Dairy Farm Profitability: The Complete Guide to Maximizing Margins (2026)
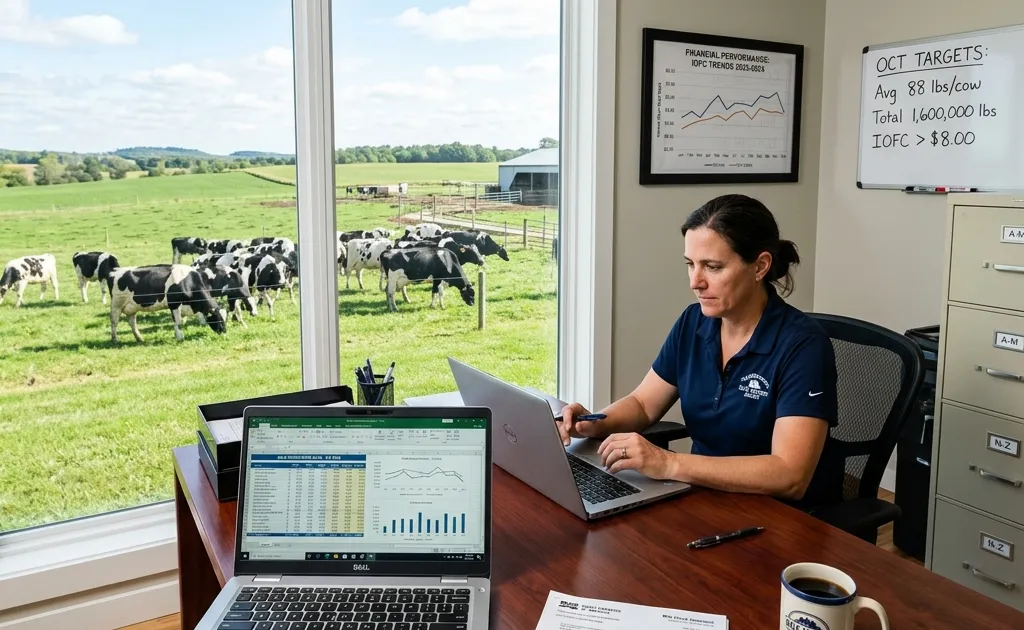
Dairy farm profitability isn't about producing the most milk — it's about producing the most margin above your costs. A 500-cow herd generating $14/cow/day IOFC produces $2.55 million in annual feed margin, while an average herd at $7/cow/day produces half that — same cows, same parlor, radically different outcome. This guide connects every financial lever available to you: IOFC, profit margins, feed costs, risk management, and the technology that makes it all measurable.
Key Takeaways
- IOFC is the #1 profitability metric — target $8–$12/cow/day depending on region and milk price
- Feed consumes 50–70% of gross revenue — every 10% reduction in feed cost adds $0.50–$1.00 to IOFC
- Top-quartile operations achieve 15–20% net margins; bottom-quartile farms lose money annually
- USDA Dairy Margin Coverage (DMC) is free risk protection — enroll before the deadline each year
- Track 5 KPIs weekly: IOFC, profit margin, feed cost per litre, feed efficiency, and SCC impact
How Profitable Is Dairy Farming in 2026?
Dairy farming is a high-volume, low-margin business. In the U.S., the average dairy farm operates on a 5–10% net profit margin, meaning for every $1.00 of milk revenue, $0.90–$0.95 goes to expenses. But averages hide a wide spread: top-quartile operations achieve 15–20% margins while bottom-quartile farms lose money every year.
The difference between profit and loss comes down to three numbers: how much milk you produce per cow, what you pay for feed, and how efficiently you convert feed to income. Every strategy in this guide targets one or more of these levers.
The Profitability Equation
Net Profit = (Milk Revenue − Feed Cost − Operating Expenses) × Number of Cows
This seems simple, but each variable has multiple sub-components. Milk revenue depends on yield AND components (butterfat and protein). Feed cost depends on forage quality, concentrate pricing, and ration formulation. Operating expenses include labor, veterinary care, breeding, and overhead. The guides below break down each component with benchmarks and calculators.
The 5 KPIs That Determine Your Profitability
Mastering dairy farm profitability means tracking five core metrics. Each one connects directly to a financial outcome. Click through to the detailed guides and calculators for each.
1. Income Over Feed Cost (IOFC) — The Gold Standard
IOFC measures how many dollars remain after subtracting feed cost from milk revenue, per cow per day. It is the single most important KPI for evaluating ration changes, forage quality, and feed pricing decisions. A cow with IOFC of $10 generates $3,650/year in feed margin; a cow at $5 generates half that.
- What is IOFC? — Complete foundational guide
- IOFC Benchmarks 2026 — Compare your herd to national data
- Feed Efficiency Explained — The biology behind IOFC
Try the IOFC Calculator
Plug in your own numbers and see where your herd stands against industry benchmarks.
2. Profit Margin Per Cow
While IOFC isolates the feed program, profit per cow captures the full financial picture — all revenue minus all costs. This is the metric your accountant cares about. Calculating it requires accurate records for every expense category.
- Dairy Farm Profit Margin Guide — Step-by-step calculation
- Dairy Profit Calculator — Instant margin analysis
3. Feed Cost Per Litre
Feed cost per litre (or per CWT in the U.S.) normalizes feed expense across different production levels. It answers: "How much does it cost me to produce one unit of milk?" Lower is better, but not at the expense of cow health or production.
- Feed Cost Per Litre — Formula and benchmarks
- Feed Cost Per Cow Benchmarks 2026 — Compare your herd
- Feed Cost Calculator — Enter your ration and get instant results
4. Feed Efficiency (ECM/DMI)
Feed efficiency measures the biological conversion of feed to milk. It tells you how many pounds of energy-corrected milk a cow produces per pound of dry matter intake. Higher feed efficiency means more milk from the same feed — directly improving IOFC.
5. Somatic Cell Count (SCC) Impact on Revenue
High SCC doesn't just mean sick cows — it means docked milk checks. Every point above 200,000 cells/ml costs you money through penalties, reduced yield, and premature culling. SCC is a profitability metric disguised as a health metric.
- What is SCC? — Causes, benchmarks, and financial impact
- SCC Penalty Calculator — See exactly how much high SCC costs you
For a comprehensive overview of all dairy farm metrics, see our Dairy Farm KPIs guide.
Milk Pricing & Revenue: The Other Side of the Equation
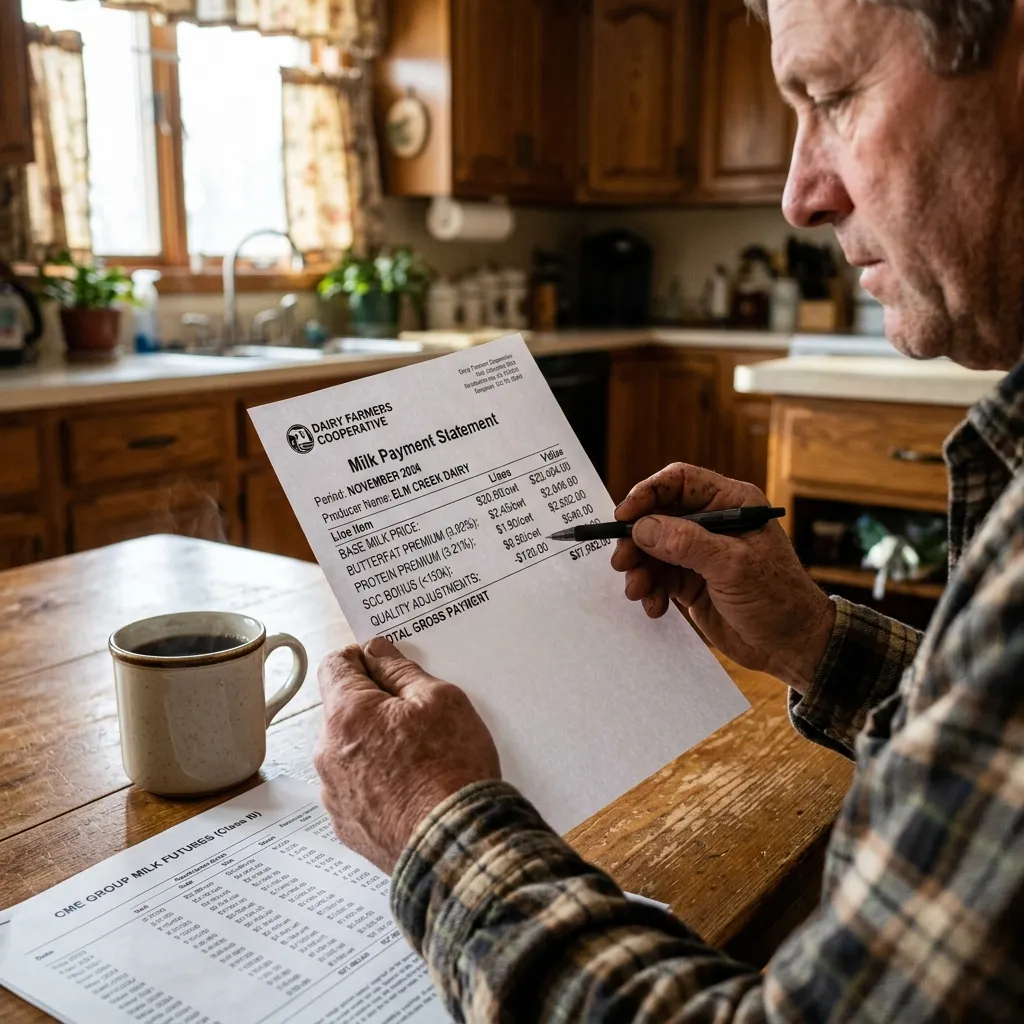
Most profitability guides focus on cutting costs. But revenue optimization is equally powerful — and often overlooked. Milk price is not a single number. It's a composite of component premiums, quality bonuses, and market class pricing that varies by region and month. Understanding how your milk check is calculated gives you leverage.
Component Pricing: Where the Real Money Is
In the U.S., most federal milk marketing orders (FMMOs) use a component pricing system. Butterfat and protein are priced separately from the base Class III milk price. In 2026, butterfat has consistently traded above $3.00/lb while protein has ranged $2.50–$3.50/lb. A herd producing milk at 4.2% butterfat vs. 3.6% butterfat generates approximately $0.80/cwt more revenue — on a 500-cow herd producing 80 lbs/day, that's $116,800/year from genetics and nutrition alone.
Protein premiums follow a similar logic. Amino acid balancing (methionine and lysine) doesn't just improve feed efficiency — it directly increases milk protein percentage, which flows straight into your milk check. See our Feed Ration Guide for how to balance protein to maximize both production and components.
Quality Bonuses and Volume Premiums
Many cooperatives and processors offer quality bonuses for SCC below 200,000 cells/ml, bacteria count targets, and antibiotic-free certification. These bonuses typically range $0.25–$1.00/cwt — a meaningful margin on top of component premiums. Some cooperatives also offer volume premiums for consistent, year-round supply. Negotiate your milk marketing contract carefully; the difference between a good contract and a poor one can be $0.50–$1.50/cwt.
How to Reduce Your Biggest Cost: Feed
Feed consumes 50–70% of gross milk revenue. Reducing feed cost by even 10% can add $0.50–$1.00 to IOFC per cow per day — across a 500-cow herd, that's $90,000–$180,000 per year in additional margin. Here are the highest-impact strategies:
- Maximize forage quality: Every 1% increase in NDF digestibility improves feed efficiency by 0.03–0.05 units. Harvest at optimal maturity, test weekly, and store properly. See our Dairy Cow Feed Ration Guide for ration balancing fundamentals.
- Balance amino acids: Rumen-protected methionine and lysine allow you to reduce crude protein by 1–2% while maintaining milk yield. Lower protein input with same output = better IOFC.
- Minimize feed waste: Refusals above 5% represent wasted nutrients. Manage bunk face width, deliver TMR consistently, and target 3–5% refusals.
- Use the calculator: Run every ration change through the Feed Cost Calculator and IOFC Calculator before implementing.
Culling Economics & Replacement Strategy
Culling decisions are among the most impactful financial levers on a dairy farm. A well-timed cull captures maximum salvage value; a late cull loses months of negative margin before you act. The average annual culling rate in the U.S. is 35–40%, but top-quartile operations maintain 25–30% through better health management and reproductive efficiency.
The Culling Decision Framework
Every cow should be evaluated against a simple question: "Will this cow generate more margin over her remaining lactation than the replacement heifer that would take her place?" A cow producing 20% below herd average for three consecutive months, with high SCC or chronic lameness, is almost certainly a culling candidate. The economic threshold is reached when the cost of keeping her (feed, treatment, lost production) exceeds her salvage value plus the opportunity cost of the stall she occupies.
Salvage Value & Replacement Cost
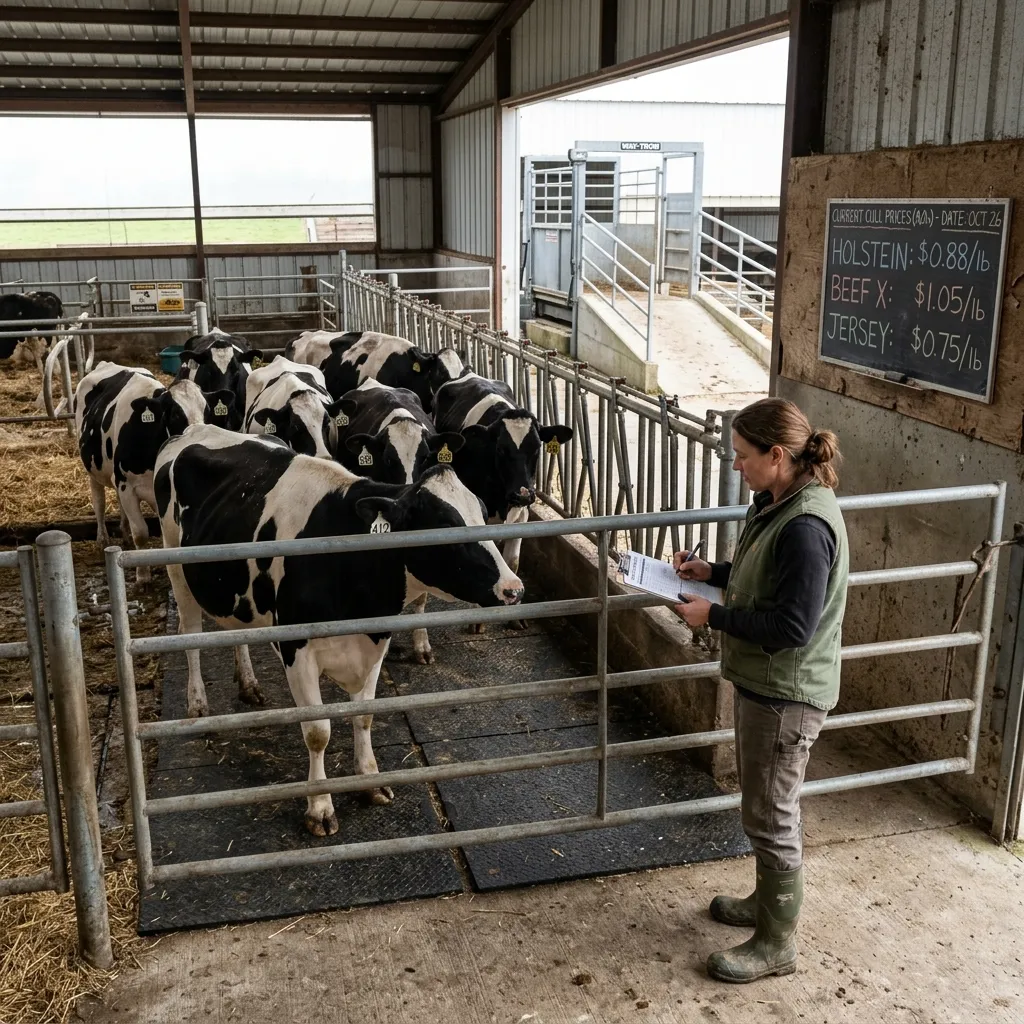
Cull cow prices in 2026 have averaged $0.65–$0.85/lb live weight. A 1,400-lb Holstein generates $910–$1,190 in salvage revenue. But the replacement cost is significant: raising a heifer from birth to first calving costs $2,000–$2,500; purchasing a springing heifer costs $1,800–$2,400. The net cost of replacement is $800–$1,500 per transition — a cost that's only justified if the new cow outperforms the old one by enough margin to pay back the investment within 24 months.
Breakeven Milk Price Analysis
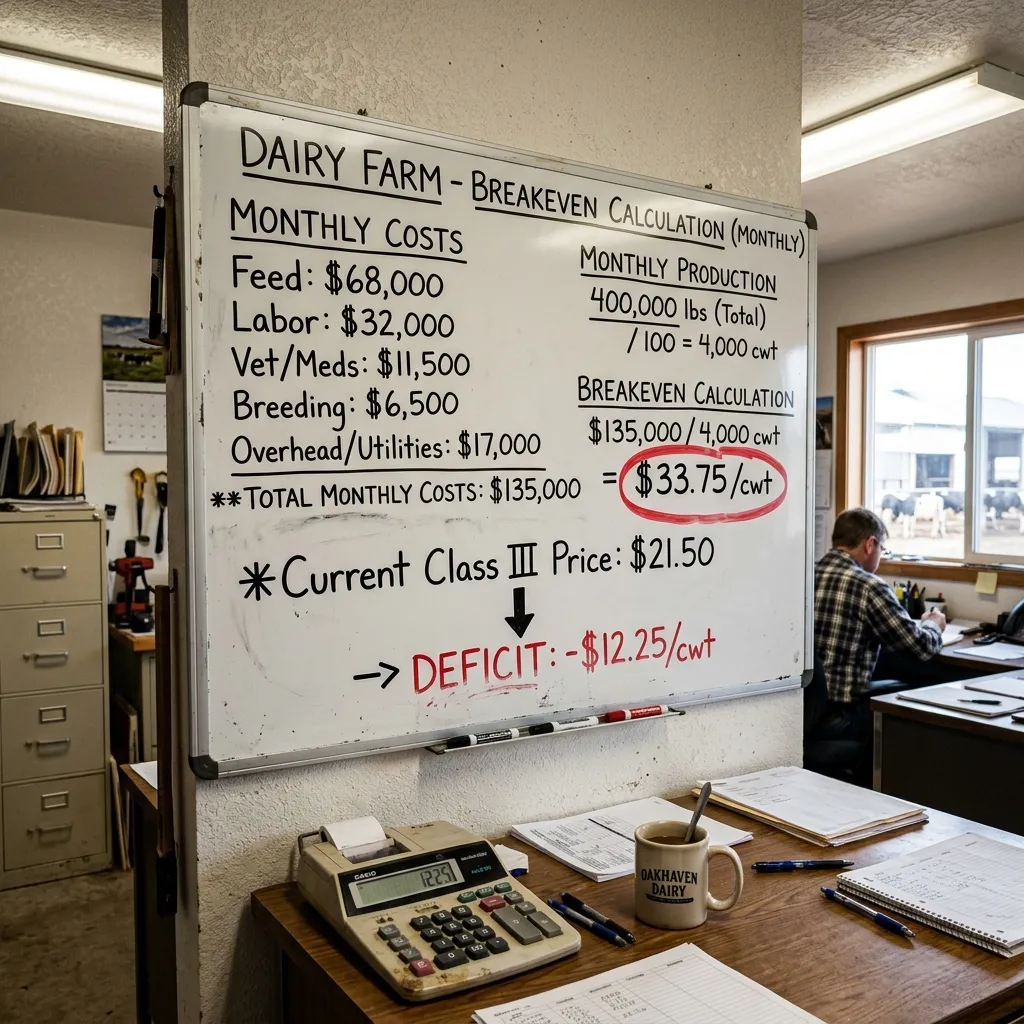
Knowing your breakeven milk price — the minimum price per cwt needed to cover all costs — is the single most important number for financial survival. When milk prices drop below breakeven, every gallon you produce loses money. When prices rise above it, every additional gallon flows directly to profit.
Calculating Your Breakeven
The formula is straightforward: Breakeven milk price = Total operating costs ÷ Total milk production (in cwt). For a typical 500-cow operation producing 80 lbs/cow/day, total costs of $18/cow/day yield a breakeven of approximately $22.50/cwt. If Class III futures are trading at $20/cwt for next quarter, you know you're underwater and need to either reduce costs or lock in a higher price through forward contracting.
Track your breakeven monthly. It changes with feed prices, production levels, and seasonal cost variations. A feed cost spike in winter can push breakeven from $22 to $26/cwt — if you haven't modeled this, you won't see it coming until the milk check arrives.
Risk Management & Insurance
The USDA Dairy Margin Coverage (DMC) program provides a safety net when the margin between milk prices and feed costs falls below a trigger level. Understanding and enrolling in DMC is a critical profitability protection strategy for U.S. dairy operations.
DMC pays an indemnity when the national all-milk price minus the average feed cost (corn, soybean meal, and alfalfa hay) falls below the coverage level you elect. Coverage ranges from $4.00 to $9.50 per cwt. Most financial advisors recommend electing $9.50 coverage for operations under 5,000 cows — the premium is modest relative to the downside protection.
The key decision is whether to elect production history based on your best three of the last five years (the "feed cost adjustment" option) or your actual production history. For most operations, the highest historical year provides the strongest coverage. Use the calculator below to model your specific scenario:
For broader financial planning, see our How to Start a Dairy Farm guide which covers business planning, capital requirements, and financial projections. If you are exploring crop insurance as a complementary risk tool, our Feed Ration Guide explains how forage pricing volatility impacts DMC margin calculations.
Additional Risk Protection: DRP and LGM-Dairy
DMC is not the only tool available. Dairy Revenue Protection (DRP) insurance, sold through private agents and backed by the USDA, pays indemnities when quarterly milk revenue falls below a guaranteed level. DRP is particularly useful for operations that want to lock in a floor price for specific quarters. Livestock Gross Margin for Dairy (LGM-Dairy) provides a similar guarantee on the margin between milk revenue and feed cost, but uses futures-based pricing rather than the DMC formula.
The optimal risk management strategy typically layers multiple programs: DMC for the baseline safety net, DRP for quarterly price protection, and forward contracting for basis management. Each tool covers a different risk — using only one leaves gaps. Consult with your local extension office or insurance agent to model which combination maximizes protection for your operation's specific cost structure.
Cash Flow Management: Surviving the Seasonal Squeeze
Dairy farm profitability is annual, but cash flow is monthly — and the two don't always align. Spring often brings high production but lower prices; winter brings high feed costs but tighter supply. A profitable operation can still fail if it runs out of cash during a seasonal trough. Cash flow management is not optional; it's survival.
The Cash Flow Calendar
Most dairy operations experience peak cash inflow from April–July (spring flush, higher production) and peak cash outflow from November–February (winter feed costs, heating,vet bills). The gap between these cycles requires either a line of credit, retained earnings from profitable months, or a combination. The minimum cash reserve should cover 60 days of operating expenses — for a 500-cow herd at $18/cow/day, that's $540,000.
Build your cash flow projection monthly, not annually. Map expected milk revenue (production × projected price), feed costs, labor, veterinary, breeding, and capital expenditures. Identify the months where outflows exceed inflows and arrange financing before you need it — banks are more willing to extend credit to operations that plan ahead than to those that call in a crisis.
Technology That Pays for Itself
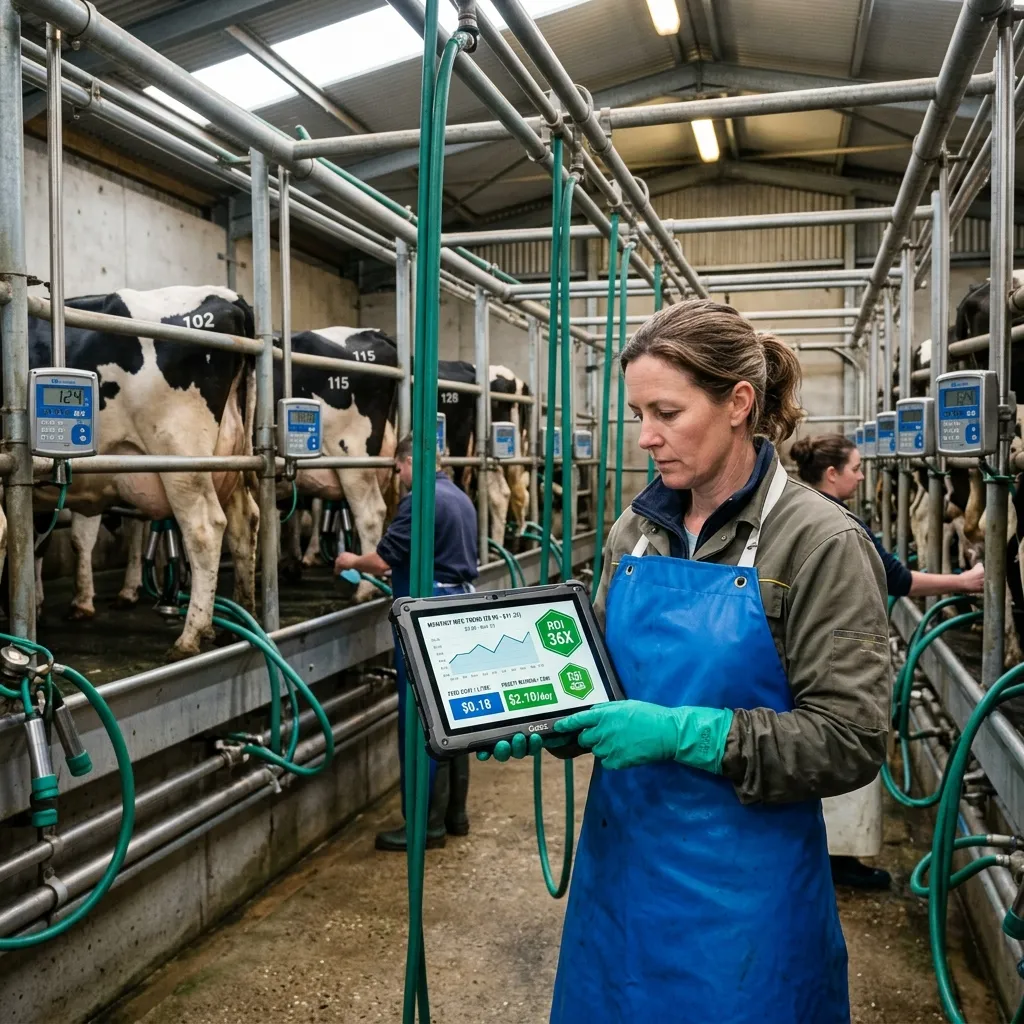
The right technology doesn't cost money — it saves money. A modern dairy farm manager uses software to track every metric on this page in real time. The question isn't whether you can afford software; it's whether you can afford to manage blind.
Consider the math: a 500-cow herd that improves IOFC by just $1/cow/day through better feed management generates an additional $182,500 per year. A $5,000/year software subscription that captures even 10% of that improvement pays for itself 36x over. The ROI on dairy farm management software is among the highest of any farm investment.
The most profitable operations use software to automate three things: (1) feed ration adjustments based on current ingredient prices, (2) heat detection and breeding timing, and (3) health alerts before clinical symptoms appear. Each of these directly impacts one of the 5 KPIs above.
Getting Started
New to dairy farming or looking to improve an existing operation? Start with these foundational guides:
Frequently Asked Questions
How profitable is dairy farming in 2026?
Dairy farm profitability varies widely by region, herd size, and management. In the U.S., well-managed herds achieve IOFC of $7–$12 per cow per day and net profit margins of 10–20%. The key drivers are feed cost management (50–70% of expenses), milk components, and culling efficiency.
What is the average profit per cow per year?
In the U.S., the average net profit per cow ranges from $1,000–$2,500 per year depending on milk price, feed costs, and herd size. Top-performing herds with optimized IOFC can exceed $3,000 per cow per year. The dairy profit margin guide explains how to calculate your specific margin.
What percentage of dairy farm revenue goes to feed?
Feed typically consumes 50–70% of gross milk revenue on dairy farms. A feed cost ratio below 50% is excellent, 50–60% is good, and above 70% signals unsustainable feed costs. Tracking feed cost per litre and IOFC helps manage this critical ratio.
How can I increase my dairy farm's profitability?
The five highest-impact strategies are: (1) optimize feed rations to improve IOFC, (2) maximize milk components through nutrition, (3) reduce health costs via preventive care and SCC management, (4) improve reproductive efficiency to shorten days open, and (5) use technology to eliminate wasted labor hours.
Is dairy farming a good investment?
Dairy farming can be a solid long-term investment with consistent cash flow, but it requires significant capital ($1–3 million for a startup operation). The ROI depends heavily on management quality — top-quartile operators consistently generate 8–15% returns on assets, while bottom-quartile operators lose money.
What is the biggest expense on a dairy farm?
Feed is the single largest expense, consuming 50–70% of gross revenue. Labor is typically the second largest at 10–15%. Managing these two costs — particularly feed efficiency and IOFC — is the most direct path to improving profitability.
 Management
 How to Start a Dairy Farm: The Complete 2026 Guide
Comprehensive step-by-step guide to starting a dairy farm. Covers startup costs, choosing breeds, essential equipment, feeding, and operations.
Read Guide → Management
 Dairy Farm KPIs: The Complete Metrics Guide (2026)
Master every dairy farm KPI — from IOFC and profit margins to SCC and pregnancy rates. Learn what to measure and industry benchmarks.
Read Guide → Management
 Dairy Farm Record Keeping Guide & Excel Templates
Master dairy farm record keeping with our complete guide. Learn the 6 essential record types, download free Excel templates, and build a routine.
Read Guide →Get dairy management tips weekly
Join 200+ dairy farmers getting practical KPIs, breeding insights, and profitability tips — no spam, unsubscribe anytime.