Dairy Farm KPIs: The Complete Metrics Guide

Track the right KPIs to transform your dairy farm from guessing to precision management. This guide covers 25+ essential metrics across production, finance, reproduction, and health — with industry benchmarks and free tools.
Get dairy management tips weekly
Join 200+ dairy farmers getting practical KPIs, breeding insights, and profitability tips — no spam, unsubscribe anytime.
What Are Dairy Farm KPIs?
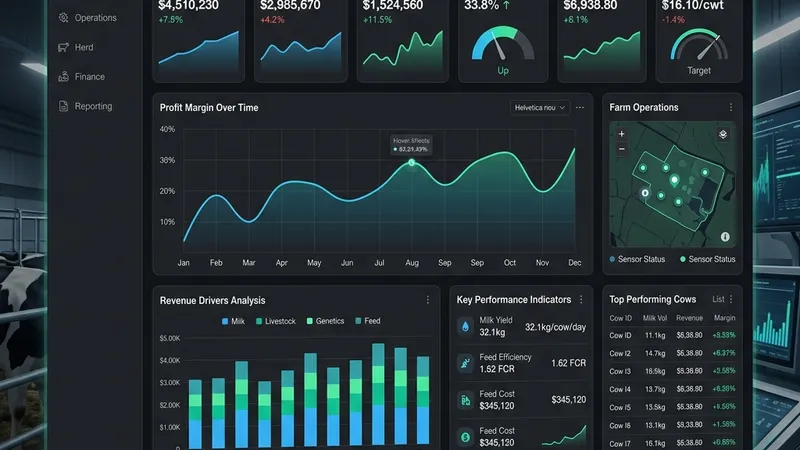
Key Performance Indicators (KPIs) are measurable values that tell you how effectively your dairy operation is performing. Without KPIs, you're managing by gut feeling. With them, you can make data-driven decisions that directly improve profitability.
Dairy farm KPIs fall into four categories:
Production
Milk yield, components, and herd output
Financial
Profit margins, revenue, and cost control
Reproductive
Pregnancy rates, calving intervals, and breeding efficiency
Health
SCC, mastitis, lameness, and culling
Production KPIs
Production KPIs measure the physical output of your herd. Higher production spreads fixed costs over more units of milk, but always evaluate production changes through the lens of IOFC — not just yield alone.

| KPI | How to Calculate | Target | Frequency |
|---|---|---|---|
| Milk Yield per Cow | Total milk (liters or lbs) ÷ number of milking cows ÷ days | 25–35 L/day (commercial) | Daily |
| Total Herd Milk | Sum of all daily milk yields | Varies by herd size | Daily |
| Peak Milk Yield | Highest daily yield in lactation | 35–45 L/day (Holstein) | Per lactation |
| Lactation Milk | Total milk produced in 305-day lactation | 8,000–12,000 L | Per lactation |
| Milk Components | Butterfat% and Protein% from milk test | Fat: 3.8–4.2%, Protein: 3.2–3.5% | Monthly |
Financial KPIs
Financial KPIs tell you whether your farm is actually making money. These are the numbers your bank, accountant, and investors care about most.
| KPI | How to Calculate | Target | Frequency |
|---|---|---|---|
| Profit per Cow | Total revenue per cow − total costs per cow | $1,500–$3,000/year | Quarterly |
| Revenue per Cow | Milk yield × milk price × 365 | $5,000–$8,000/year | Monthly |
| Feed Cost per cwt | Total feed cost ÷ total milk (in cwt) | $5–$8/cwt | Monthly |
| Cost of Production | Total farm costs ÷ total milk produced | $12–$18/cwt | Monthly |
| Break-Even Milk Price | Total costs ÷ total milk (in cwt) | $15–$22/cwt | Quarterly |
Use our Dairy Farm Profit Calculator to instantly calculate profit per cow, revenue, and cost breakdowns.
Reproductive KPIs
Reproductive efficiency directly impacts lifetime milk production and herd profitability. A cow that doesn't get pregnant on time costs you money every day she's open.
| KPI | How to Calculate | Target | Frequency |
|---|---|---|---|
| Pregnancy Rate | Pregnancies ÷ eligible cows × 100 | 25–35% | Monthly |
| Calving Interval | Days between consecutive calvings | 12.5–13 months | Per event |
| Days Open | Days from calving to confirmed pregnancy | 85–115 days | Per event |
| First Service Conception Rate | Conceptions at first AI ÷ total first services × 100 | 30–45% | Monthly |
| Service Period | Days from calving to last insemination | 80–120 days | Per event |
Use our Calving Date Calculator to plan dry-off dates, colostrum windows, and breeding schedules, and check out our guide on how to calculate calving dates.
Health KPIs
Healthy cows produce more milk, reproduce better, and live longer. Monitoring health KPIs lets you catch problems early before they become expensive.
| KPI | How to Calculate | Target | Frequency |
|---|---|---|---|
| Somatic Cell Count (SCC) | Cells/mL from milk test | < 200,000 | Monthly |
| Mastitis Incidence | New mastitis cases ÷ cow-days at risk × 1,000 | < 2.0 / 1,000 cow-days | Monthly |
| Lameness Prevalence | Lame cows ÷ total herd × 100 | < 15% | Monthly |
| Cull Rate | Cows culled ÷ average herd size × 100 | < 35%/year | Annual |
| Mortality Rate | Deaths ÷ average herd size × 100 | < 5%/year | Annual |
Feed Efficiency KPIs
Feed is the single largest variable cost on any dairy farm (40–60% of total expenses). These KPIs tell you whether your feed program is actually profitable.
| KPI | How to Calculate | Target | Frequency |
|---|---|---|---|
| IOFC per Cow per Day | (Milk price × yield) − feed cost | > $10/day | Weekly |
| Feed Cost Ratio | (Feed cost ÷ milk revenue) × 100 | < 50% | Monthly |
| Dry Matter Intake (DMI) | Total feed consumed ÷ dry matter % | 4.0–4.5% of body weight | Weekly |
| Feed Conversion Ratio | DMI ÷ milk yield | 0.30–0.40 kg DMI/kg milk | Monthly |
| Forage-to-Concentrate Ratio | Forage DM ÷ total diet DM | 60:40 to 70:30 | Per ration |
Try the IOFC Calculator
Plug in your own numbers and see where your herd stands against industry benchmarks.
Calculate Your Time Savings ROI
See how much time and money you could save by switching from spreadsheets to digital herd management.
Industry Benchmark Table
Use these benchmarks to see where your farm stands. Excellent operations consistently hit the "Excellent" column; most commercial farms target "Good."
| KPI | Excellent | Good | Average | Poor |
|---|---|---|---|---|
| Milk Yield (Holstein) | > 35 L/day | 28–35 L/day | 20–28 L/day | < 20 L/day |
| IOFC | > $10/day | $7–10/day | $5–7/day | < $5/day |
| Feed Cost Ratio | < 45% | 45–55% | 55–65% | > 65% |
| Profit Margin | > 30% | 20–30% | 10–20% | < 10% |
| SCC | < 150K | 150–250K | 250–400K | > 400K |
| Pregnancy Rate | > 35% | 25–35% | 18–25% | < 18% |
| Calving Interval | < 12.5 mo | 12.5–13 mo | 13–14 mo | > 14 mo |
| Cull Rate | < 25% | 25–35% | 35–45% | > 45% |
Free Calculator Tools
Stop doing math in spreadsheets. Use our free online calculators to get instant answers on any device.
IOFC Calculator
Calculate Income Over Feed Cost per cow per day. The gold standard KPI for dairy feed efficiency and profitability.
Open Calculator → 💰Dairy Profit Calculator
Estimate your farm's monthly and annual net income based on herd size, milk yield, price, and costs.
Open Calculator → 🐄Calving Date Calculator
Predict expected calving dates, dry-off windows, and colostrum schedules from insemination dates.
Open Calculator →Proven Strategies to Improve Your KPIs
Track IOFC Weekly
IOFC is your most actionable KPI. Track it weekly to catch feed cost spikes or milk price drops early. Even a $0.50/cow/day improvement adds $18,000/year for a 100-cow herd.
Optimize Rations by Lactation Stage
Dry cows, transition cows, early lactation, and peak lactation all need different nutrient densities. Over-feeding mid-lactation cows wastes feed; under-feeding early-lactation cows limits peak yield.
Cull Strategically
Cows with low milk yield but similar feed intake drag down herd averages. Identify cows below break-even IOFC and make data-driven culling decisions.
Monitor SCC Monthly
Every 100,000 increase in SCC above 200,000 costs $0.50–$1.00/cow/day. Invest in pre- and post-milking teat dipping, proper milking protocols, and dry cow therapy. Learn more in our complete guide to somatic cell count.
Reduce Feed Waste
Feed refusals, spoiled silage, and inefficient bunk management waste 5–15% of purchased feed. Tighten delivery schedules, manage bunk face width, and keep refusals below 3–5%.
Review KPIs Monthly
Schedule a monthly management meeting to review all KPIs against benchmarks. Celebrate improvements, investigate declines, and assign action items for the coming month.
Frequently Asked Questions
What are the most important KPIs for a dairy farm?
The most critical KPIs are: Income Over Feed Cost (IOFC), milk yield per cow per day, feed cost ratio, profit margin per cow, somatic cell count (SCC), pregnancy rate, and calving interval. These cover production, financial, health, and reproductive performance — the four pillars of dairy profitability.
How do I calculate dairy farm profit per cow?
Profit per cow = (Milk Revenue per Cow) − (Total Costs per Cow). Milk Revenue = Milk Yield × Milk Price. Total Costs include feed, labor, veterinary, bedding, utilities, depreciation, and overhead. Use the Dairy Farm Profit Calculator for a detailed breakdown.
What is a good milk yield per cow per day?
In the US, the average Holstein produces 70–85 lbs (about 32–39 kg) per day. Jerseys average 45–55 lbs. Global averages range from 15–25 liters for smallholder systems to 30–40 liters for commercial operations. Higher is not always better — profitability depends on IOFC.
What is IOFC and why does it matter?
Income Over Feed Cost (IOFC) is milk revenue minus feed cost per cow per day. It's the single most important metric for evaluating feed program profitability. A good IOFC is above $10/day; $7–10 is good; below $5 signals problems. Use the IOFC Calculator to track this daily.
What is the ideal feed cost ratio for dairy?
Feed cost ratio is feed cost divided by milk revenue (as a percentage). Below 50% is excellent, 50–60% is good, 60–70% is fair, and above 70% means feed costs are unsustainable. Most profitable operations keep feed cost ratio between 40–55%.
How often should I track dairy farm KPIs?
Track IOFC and milk yield weekly (or daily if possible). Track feed cost ratio and SCC monthly. Track profit margin quarterly. Track reproductive KPIs (pregnancy rate, calving interval) monthly. Review all KPIs in a monthly management meeting.
What is a good somatic cell count (SCC)?
Below 200,000 cells/mL is excellent (Grade A). 200,000–400,000 is acceptable. Above 400,000 indicates mastitis problems and milk quality issues. Every 100,000 increase in SCC above 200,000 costs approximately $0.50–$1.00/cow/day in lost revenue and treatment costs.
What is a good pregnancy rate for dairy cows?
A pregnancy rate of 25–35% is considered good. Above 35% is excellent. Below 20% indicates reproductive management problems. Pregnancy rate = (number of pregnancies / number of eligible cows) × 100. It directly impacts calving interval and lifetime milk production.
How do I improve dairy farm profitability quickly?
The fastest levers are: (1) Optimize the ration to improve IOFC — even $0.50/cow/day adds up fast, (2) Cull low-performing cows that drag down herd averages, (3) Reduce feed waste — 5–15% of feed is often wasted, (4) Negotiate bulk feed purchases, (5) Improve milking frequency from 2x to 3x for 10–15% yield boost.
What is the break-even milk price?
Break-even milk price is the price per hundredweight (cwt) where total revenue equals total costs. For most US dairies, this ranges from $15–$22/cwt. Calculate it by dividing total annual costs by total annual milk production (in cwt). Lower break-even means more resilience to price drops.
References
- Penn State Extension — "Managing Income Over Feed Costs in Dairy Herds"
- Virginia Tech DASC — Dairy metrics and IOFC methodology
- NASEM — Nutrient Requirements of Dairy Cattle, 8th Edition
- Journal of Dairy Science — Peer-reviewed research on reproductive and health KPIs in dairy production