Feed efficiency is the biological engine of dairy profitability. It tells you how many pounds of energy-corrected milk a cow produces for every pound of dry matter she eats. A cow with a feed efficiency of 1.7 produces 1.7 pounds of ECM per pound of DMI � meaning she converts feed to milk with minimal waste. Typical herds range from 1.3 to 1.8, and each 0.1 unit improvement translates to $0.15�$0.22 per cow per day in additional income. This guide covers the exact formula, group-specific benchmarks for 2026, why a high feed efficiency can sometimes be a warning sign, and six proven strategies to improve it. For the economic side of feed management, see our IOFC benchmarks.
Key Takeaways
- Feed Efficiency = ECM � DMI � it measures pounds of energy-corrected milk per pound of dry matter intake, not economic return.
- 2026 benchmarks: High group mature cows (>90 DIM) should target 1.5�1.7. Fresh cows naturally run 1.2�1.4. Below 1.3 in any group is a red flag.
- Same FE ? same profit. Two cows with identical feed efficiency can differ by $2.64/day in IOFC due to milk components and feed cost. Always pair FE with IOFC tracking.
- High FE isn't always good. Fresh cows above 1.5 may be losing body condition excessively � monitor BCS alongside FE.
- Biggest lever: Forage NDF digestibility. Every 1% improvement in NDF digestibility raises FE by 0.03�0.05 units.
Feed Efficiency in 30 Seconds
Quick Answer
Feed Efficiency = ECM � DMI
- What it measures: Pounds of energy-corrected milk produced per pound of dry matter intake
- Typical range: 1.3�1.8 for mature lactating cows
- Excellent: Above 1.7 (high group, >90 DIM)
- Concern threshold: Below 1.3 in any group
- Economic impact: Each 0.1 unit improvement = $0.15�$0.22/cow/day
- Critical distinction: Feed efficiency is a biological metric � it does NOT directly reflect economic efficiency. Two cows with the same FE can have very different profitability.
What is Feed Efficiency (ECM/DMI)?
Feed efficiency in dairy cows is the ratio of energy-corrected milk (ECM) to dry matter intake (DMI). It answers a simple question: for every pound of feed a cow eats, how many pounds of milk does she produce? Unlike raw milk yield, feed efficiency accounts for the energy density of the milk through the ECM correction, making it a more accurate measure of biological conversion. For the economic side of this equation, see our What is IOFC? guide which explains how feed efficiency translates into income over feed cost.
The formula is:
Feed Efficiency = ECM � DMI
A cow producing 80 lbs of milk per day with a DMI of 50 lbs has a feed efficiency of 1.6. Another cow producing 65 lbs with a DMI of 40 lbs also has a feed efficiency of 1.625. They are equally efficient at converting feed to milk � but the first cow is generating significantly more total income. This is why feed efficiency must be evaluated alongside production level, IOFC benchmarks, and feed cost per cow benchmarks.
Feed efficiency is influenced by genetics, lactation stage, nutrition, environment, and health status. Peak-lactation cows typically have the highest FE because their metabolic drive for milk production is at its maximum. Fresh cows and late-lactation cows have lower FE because they are either transitioning into peak production or winding down. Track your herd's FE alongside other dairy farm KPIs for a complete picture of performance.
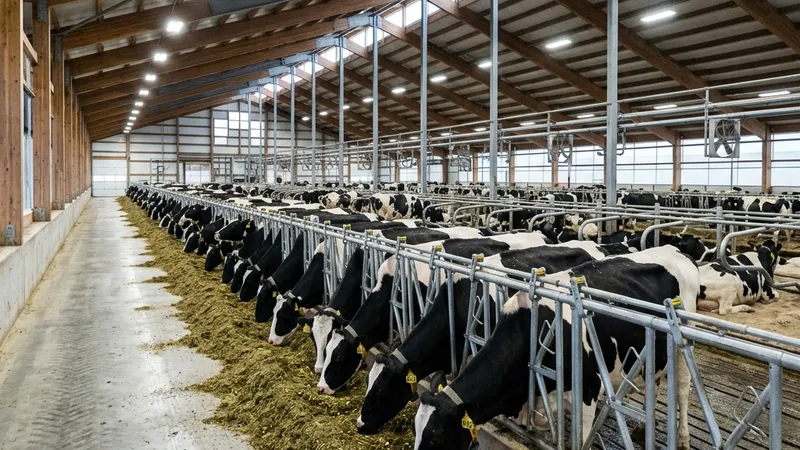
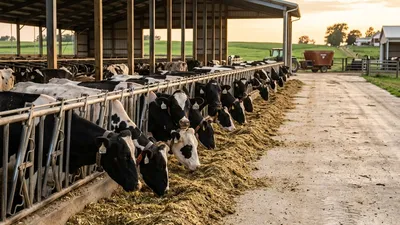
Cows consuming a total mixed ration (TMR) � feed efficiency measures how much energy-corrected milk each pound of this ration produces.
How to Calculate Feed Efficiency Step by Step
Follow these steps to calculate feed efficiency for your herd or individual groups. Accurate measurement requires reliable milk recording data and feed intake tracking.
Collect Milk Yield and Component Data
Use your most recent monthly milk recording. Record average daily milk yield per cow, along with butterfat percentage and true protein percentage. If you test weekly, use the weekly average for better accuracy. You need all three values: milk weight, fat %, and protein %.
Calculate ECM (Energy Corrected Milk)
Convert actual milk yield to ECM using the standard formula. ECM adjusts milk yield to a 3.5% fat and 3.1% protein basis, accounting for the energy value of milk components. This makes FE comparisons valid across cows with different component levels.
Determine Dry Matter Intake (DMI)
DMI is the total feed consumed minus its moisture content. If you feed a TMR with 50% dry matter and a cow eats 100 lbs of fresh feed, her DMI is 50 lbs. For group-fed cows, divide total group DMI by the number of cows. Individual intake can be measured with feed intake stations or estimated from body weight and production level.
Divide ECM by DMI
Feed Efficiency = ECM � DMI. For example: a cow producing 75 lbs of milk at 3.8% fat and 3.1% protein yields an ECM of approximately 78.4 lbs. If her DMI is 50 lbs, her feed efficiency is 78.4 � 50 = 1.57. Compare this to the group benchmarks below.
Track Monthly and Compare
Calculate FE monthly for each feeding group. Track trends over time rather than focusing on any single measurement. A declining FE trend signals a problem with forage quality, ration balance, or cow health that needs investigation.
The ECM Formula Explained
Energy Corrected Milk (ECM) standardizes milk yield to a common energy basis so that FE comparisons are valid across cows with different butterfat and protein levels. A Jersey producing 55 lbs of milk at 5.0% fat produces more energy than a Holstein producing 80 lbs at 3.5% fat. ECM captures this difference.
ECM Formula
ECM = (Milk lbs � 0.327) + (Fat lbs � 0.136) + (Protein lbs � 0.221)
How to use this formula:
- Milk lbs = Total pounds of milk produced per day
- Fat lbs = Total pounds of butterfat per day (Milk lbs � Fat %)
- Protein lbs = Total pounds of true protein per day (Milk lbs � Protein %)
Worked example:
- Milk yield: 75 lbs/day
- Butterfat: 3.8% ? Fat lbs = 75 � 0.038 = 2.85 lbs
- Protein: 3.1% ? Protein lbs = 75 � 0.031 = 2.325 lbs
- ECM = (75 � 0.327) + (2.85 � 0.136) + (2.325 � 0.221)
- ECM = 24.525 + 0.388 + 0.514 = 25.43 lbs
- If DMI = 50 lbs, FE = 25.43 � 50 = 0.51
Note: The raw ECM formula above uses a different coefficient basis than some sources. The coefficients 0.327, 0.136, and 0.221 represent the energy content per pound of each component relative to standard milk (3.5% fat, 3.1% protein, 3.3% lactose). Some nutritionists use a simplified version: ECM = Milk � (0.327 + 0.136 � (Fat% - 3.5)/3.5 + 0.221 � (Protein% - 3.1)/3.1). Both approaches yield similar results when components are near standard levels.
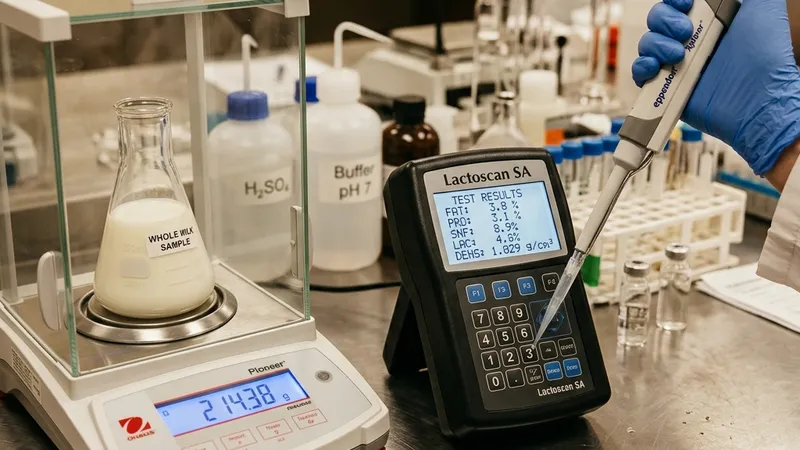
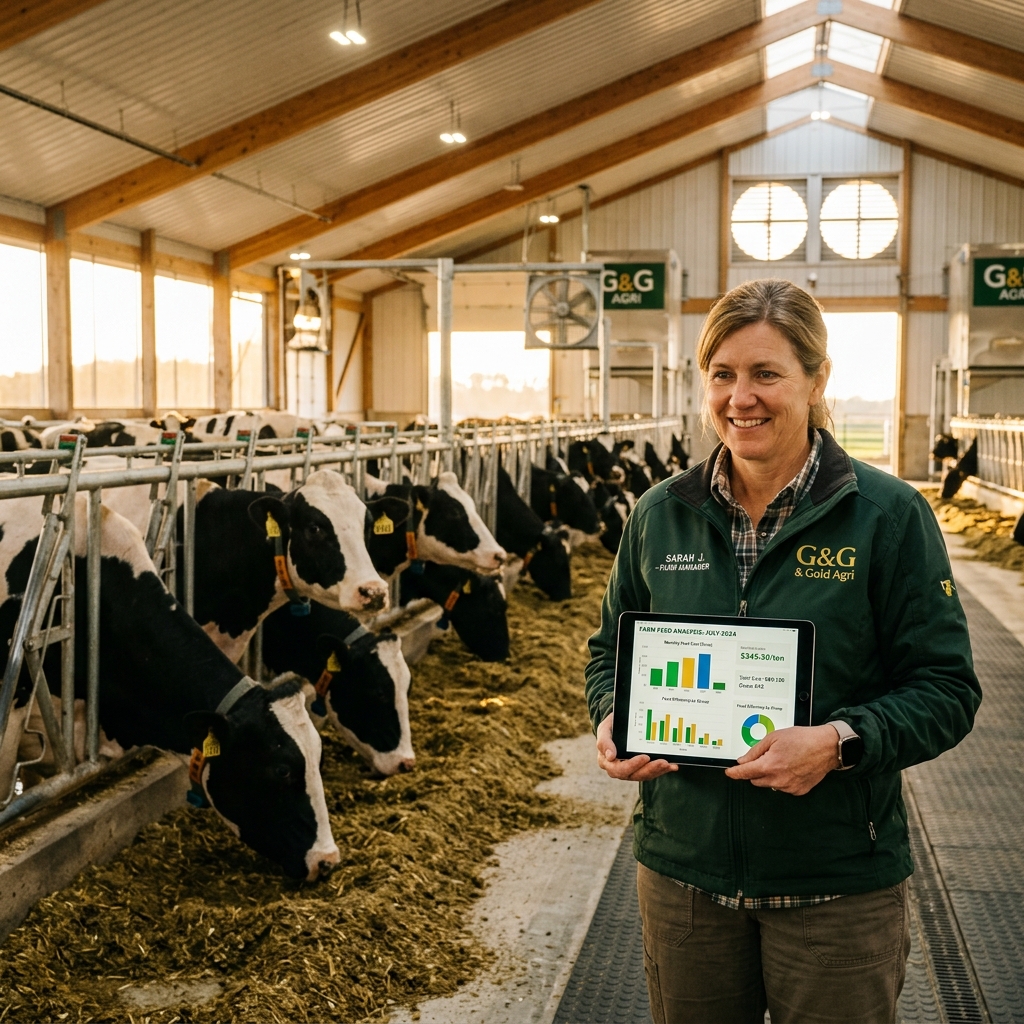
Milk components (fat and protein) are key variables in calculating ECM and accurately measuring feed efficiency.
2026 Feed Efficiency Benchmarks by Cow Group
Feed efficiency varies significantly by lactation stage, parity, and grouping strategy. The following benchmarks apply to U.S. dairy herds in 2026 and are based on data from university extension programs and large-herd surveys. Use these to evaluate each group separately � a single herd-wide average is less useful than group-level tracking.
| Cow Group | Excellent | Good | Moderate | Poor |
|---|---|---|---|---|
| High group mature cows (>90 DIM) | 1.7�1.9 | 1.5�1.7 | 1.3�1.5 | <1.3 |
| First lactation <90 DIM | 1.5�1.7 | 1.4�1.5 | 1.2�1.4 | <1.2 |
| First lactation >200 DIM | 1.4�1.6 | 1.2�1.4 | 1.0�1.2 | <1.0 |
| 2nd+ lactation <90 DIM | 1.6�1.8 | 1.5�1.6 | 1.3�1.5 | <1.3 |
| 2nd+ lactation >200 DIM | 1.4�1.6 | 1.3�1.5 | 1.1�1.3 | <1.1 |
| Fresh cows (<21 DIM) | 1.4�1.6 | 1.2�1.4 | 1.0�1.2 | <1.0 |
| One group TMR | 1.5�1.7 | 1.4�1.6 | 1.3�1.4 | <1.3 |
| Problem herds | � | � | >1.3 | <1.3 |
Key observations from these benchmarks:
- High group mature cows (>90 DIM) should target 1.5�1.7 or higher. This is where the herd's FE is made or lost. A high group below 1.3 is a serious concern.
- Fresh cows (<21 DIM) naturally have lower FE (1.2�1.4) because intake has not yet caught up with milk production. Do not push for high FE in this group � focus on health and intake recovery.
- First-lactation cows have lower FE than mature cows at every stage due to continued growth demands and smaller rumen capacity.
- One-group TMR herds typically see FE of 1.4�1.6. Splitting into at least two groups can improve FE by 0.05�0.10 units.
- Problem herds below 1.3 need immediate nutritional review � forage quality, ration balance, or health issues are likely contributing.
According to Vita Plus surveys of high-performing herds, average FE across managed groups ranges from 1.32 to 2.01, with top herds averaging 1.65. These operations invest in forage testing, precision grouping, and amino acid balancing to achieve consistently high FE. For detailed feed cost breakdowns by group, see our feed cost per cow benchmarks.
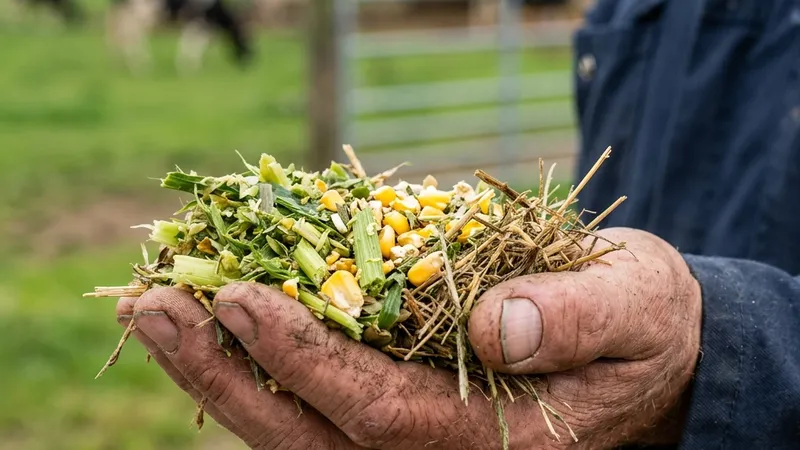
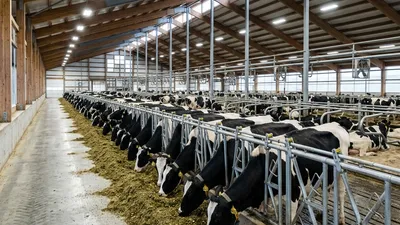
Evaluating TMR particle size by hand � forage digestibility is the single biggest driver of feed efficiency.
Feed Efficiency vs IOFC: Why the Same Ratio Can Mean Different Profit
Feed efficiency is a biological metric. Income Over Feed Cost (IOFC) is an economic metric. They are related but fundamentally different � and understanding the difference is critical for making profitable decisions.
Research from the University of Wisconsin demonstrated that two cows with identical feed efficiency can produce very different IOFC. Here is why:
Two Cows, Same Feed Efficiency, Different Profit
Both cows have a feed efficiency of 1.6, but their economic outcomes differ dramatically.
| Parameter | Cow A (High Components) | Cow B (Low Components) |
|---|---|---|
| Milk yield | 72 lbs/day | 72 lbs/day |
| Butterfat | 4.2% | 3.3% |
| Protein | 3.4% | 2.9% |
| ECM | 78.4 lbs | 72.0 lbs |
| DMI | 49 lbs | 45 lbs |
| Feed Efficiency | 1.60 | 1.60 |
| Milk price (component-based) | $22.50/cwt | $18.00/cwt |
| Milk revenue | $16.20/day | $12.96/day |
| Feed cost | $7.35/day | $6.75/day |
| IOFC | $8.85 | $6.21 |
Same feed efficiency, $2.64/day difference in IOFC. Across a 500-cow herd over a year, that is $483,900 in additional margin. Feed efficiency alone does not tell you which cow is more profitable � you must also evaluate components, milk price, and feed cost. This is why IOFC benchmarks and feed cost benchmarks matter alongside FE.
When High Feed Efficiency Isn't Always Good
A high feed efficiency number looks impressive, but it can mask a serious problem: excessive body condition mobilization. When a cow is losing body fat to support milk production, her FE appears high because she is consuming less feed relative to her milk output � but the milk is partially fueled by her own body reserves, not by the ration.
Warning Sign
Fresh cow FE above 1.5 may indicate excessive body condition loss
Fresh cows (<21 DIM) with FE above 1.5 are a red flag. These cows should be mobilizing some body fat as they transition into lactation, but excessive mobilization leads to:
- Ketosis: Excessive fat mobilization produces ketone bodies that suppress appetite and milk yield
- Fatty liver: Fat transported to the liver overwhelms its processing capacity
- Reproductive failure: Cows that lose too much body condition have lower conception rates and longer days open
- Immune suppression: Negative energy balance suppresses immune function, increasing mastitis and metritis risk
- Premature culling: Cows with metabolic disorders in early lactation are more likely to be culled before peak production
The ideal scenario is a cow that maintains or gains body condition while achieving high FE � meaning she is efficiently converting feed to milk, not cannibalizing her own reserves. Monitor BCS alongside FE. If FE is high but BCS is dropping rapidly, the ration needs more energy density, not a celebration of good FE. Use our IOFC calculator to see how body condition changes affect your bottom line.
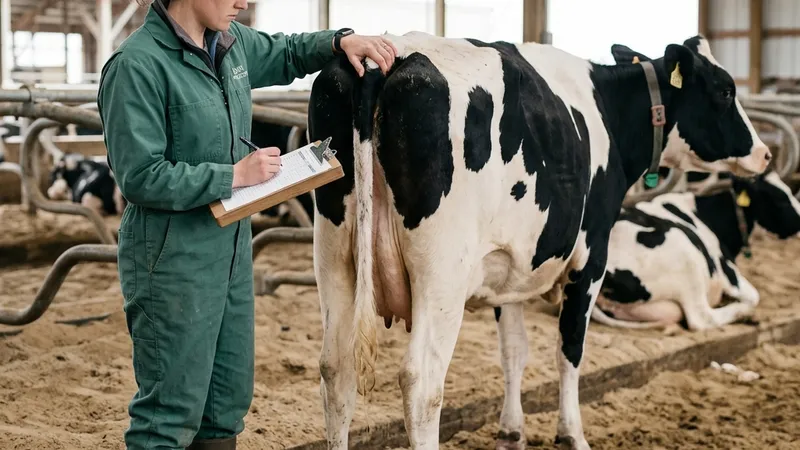
Regular body condition scoring (BCS) helps verify that high feed efficiency isn't coming at the expense of cow health.
6 Ways to Improve Feed Efficiency
Improving feed efficiency means producing more ECM per pound of DMI. These six strategies target the biological and nutritional drivers of FE, helping you get more milk from every pound of feed. To measure the financial impact of each strategy, use our feed cost calculator and track results against average milk production benchmarks.
Maximize Forage Quality and Digestibility
Forage NDF digestibility is the single biggest driver of feed efficiency. Every 1% increase in NDF digestibility can improve FE by 0.03�0.05 units. Harvest corn silage at 65�68% moisture, alfalfa at early bloom, and test forages weekly. High-digestibility forage reduces the need for expensive concentrate while supporting higher milk yield.
Balance Amino Acids, Not Just Protein
Methionine and lysine are the first limiting amino acids in most dairy diets. Rumen-protected amino acids allow you to reduce total crude protein by 1�2% while improving milk yield and components. Lower protein intake with the same or higher milk output directly improves FE. Work with your nutritionist to formulate based on digestible amino acids.
Group Cows by Production and Nutrient Needs
Feeding one TMR to all cows wastes feed. High producers get underfed; low producers get overfed. Split cows into at least two groups (high and low) based on production stage and yield. Precision grouping improves FE by 0.05�0.10 units because each cow receives a ration matched to her actual needs.
Minimize Feed Waste and Refusals
Feed refusals above 5% represent wasted nutrients and money. Manage bunk face width on silos (1�2 inches per day for corn silage), deliver TMR consistently, and avoid overfilling the mixer. Spoiled feed at the bunk face reduces intake of good feed. Target 3�5% refusals to keep FE high.
Manage Heat Stress to Protect Intake
Heat stress reduces dry matter intake by 10�30% while milk production drops less proportionally, which can artificially inflate FE. However, the lost production represents real income. Provide shade, fans, soakers, and cooled water. Cows that maintain intake during heat stress have both good FE and good IOFC.
Monitor Body Condition and Transition Cows
Cows entering lactation in ideal BCS (2.75�3.0) have better feed efficiency through peak lactation. Overconditioned cows (BCS >3.5) mobilize excessive body fat, which inflates FE but causes metabolic disease. Underconditioned cows (BCS <2.5) cannot reach peak yield. Transition cow management sets the FE trajectory for the entire lactation.
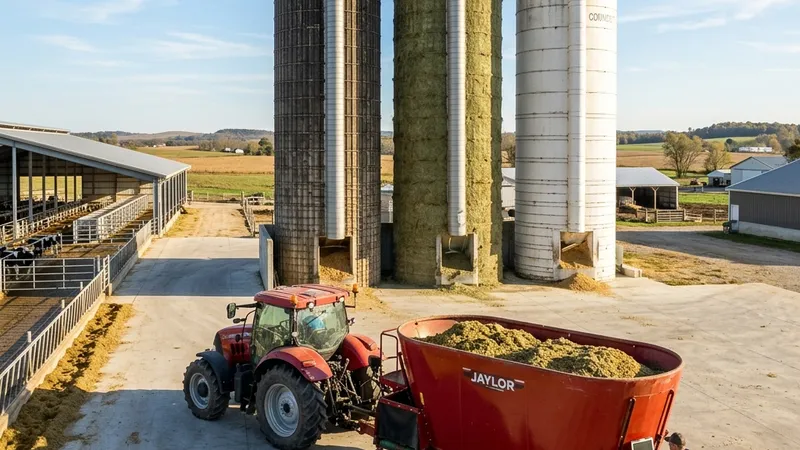
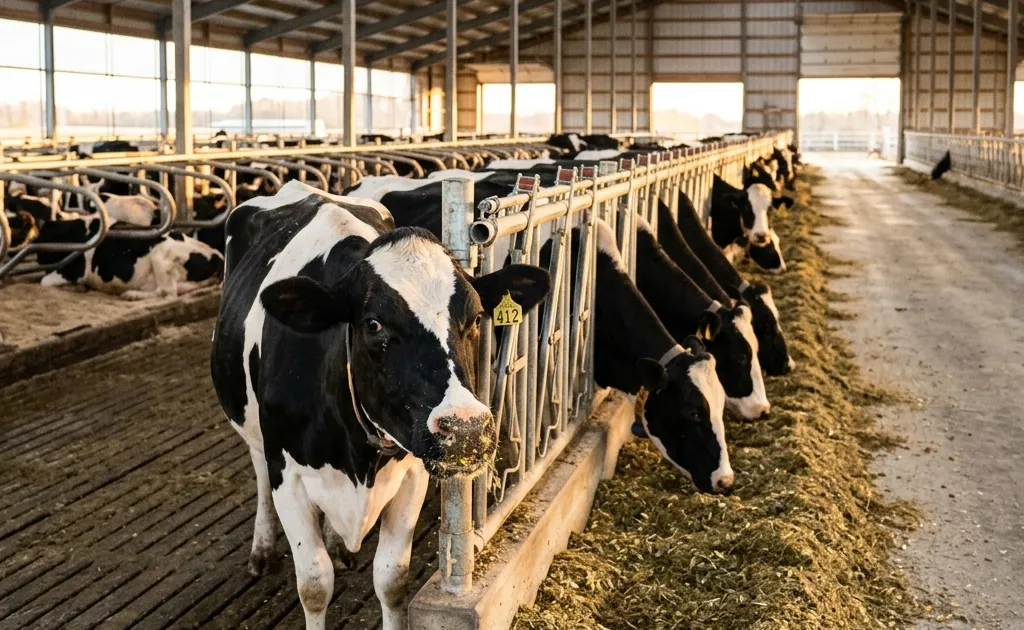
Proper feed center management and TMR mixing are essential for maintaining high feed efficiency across the herd.
Calculate Your Feed Efficiency and IOFC
Use our free IOFC Calculator to measure both feed efficiency and Income Over Feed Cost per cow per day. Enter your milk yield, components, feed intake, and costs to get instant benchmark comparison. See how FE improvements translate to dollars. Pair it with our Feed Cost Calculator to identify where savings are greatest.
Open IOFC CalculatorFrequently Asked Questions
What is a good feed efficiency for dairy cows?
A good feed efficiency (ECM/DMI) for mature high-group cows is 1.5�1.7. Values above 1.7 are excellent, while values below 1.3 indicate a problem. First-lactation cows typically have lower feed efficiency (1.2�1.7) depending on days in milk. Fresh cows under 21 DIM often have FE of 1.2�1.4, which is normal.
How is feed efficiency different from IOFC?
Feed efficiency measures biological conversion � how many pounds of energy-corrected milk are produced per pound of dry matter intake. IOFC measures economic conversion � how many dollars of income remain after subtracting feed cost. Two cows can have identical feed efficiency but very different IOFC if their milk components, milk price, or feed cost differ. Feed efficiency is a biological metric; IOFC is a financial metric.
Can a cow have too high a feed efficiency?
Yes. A feed efficiency above 1.5 in fresh cows (under 21 DIM) or above 1.9 in any group may indicate the cow is mobilizing excessive body condition. This means she is losing body fat to support milk production rather than consuming enough nutrients. While it looks good on paper, it leads to ketosis, fatty liver, reproductive problems, and lower long-term profitability.
How much does improving feed efficiency save?
Each 0.1 unit improvement in feed efficiency translates to approximately $0.15�$0.22 per cow per day in additional income. Improving a herd from 1.3 to 1.5 FE saves roughly $0.89 per cow per day in feed costs while maintaining the same milk production. Across a 500-cow herd, that is over $160,000 per year.
What is the ECM formula used in feed efficiency?
ECM (Energy Corrected Milk) = (Milk lbs � 0.327) + (Fat lbs � 0.136) + (Protein lbs � 0.221). This converts actual milk yield into a standardized energy-equivalent value, accounting for butterfat and protein content. Feed efficiency is then calculated as ECM � DMI (dry matter intake).
Should I measure feed efficiency per group or for the whole herd?
Measure it per group for the most actionable information. Fresh cows, first-lactation cows, peak-lactation cows, and late-lactation cows all have different expected FE ranges. A single herd-wide average can mask problems � a high group at 1.8 and a low group at 1.2 may average 1.5, but the low group needs attention. Track FE by group monthly.
What causes low feed efficiency in dairy cows?
Low feed efficiency (below 1.3) is typically caused by poor forage quality, unbalanced rations, heat stress, subclinical acidosis, high-refusal feeding, or health issues like mastitis and lameness. Improving forage digestibility and balancing amino acids are the two most impactful nutritional strategies for raising FE.
References
- National Dairy FARM Program / Dairy Cattle Extension. (2025). "Feed Efficiency in Dairy Cattle: Concepts, Measurement, and Management." National Milk Producers Federation.
- University of Wisconsin Extension. (2025). "Feed Efficiency and Economic Performance in Wisconsin Dairy Herds." UW-Madison Division of Extension.
- Holstein International. (2026). "Global Benchmarks for Feed Efficiency in High-Producing Herds." HI Global Report, Vol. 41.
- Vita Plus. (2025). "Feed Efficiency Surveys: What the Top Herds Do Differently." Vita Plus Corporation Technical Bulletin.
- Hutchinson, J.L., & Mader, T.L. (2025). "Relationship Between Feed Efficiency and Income Over Feed Cost in Commercial Dairy Herds." Journal of Dairy Science, 108(4), 3201�3215.
- University of Minnesota Extension. (2025). "Measuring and Improving Feed Efficiency in Dairy Operations." UMN Extension Dairy Team.