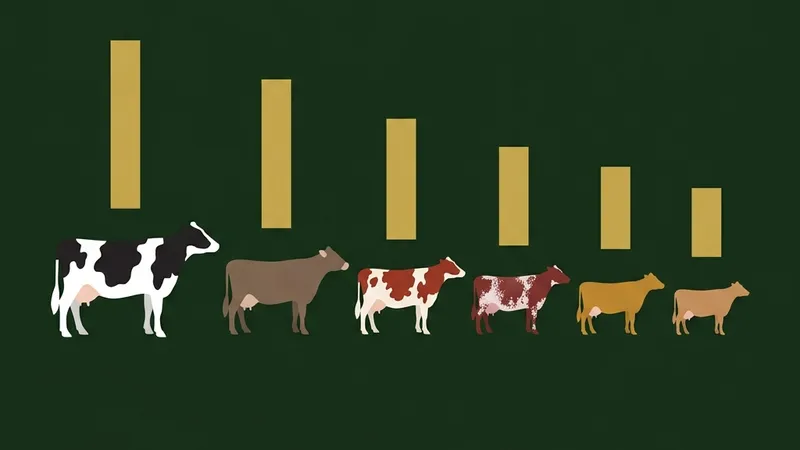
A typical dairy cow produces 25–30 litres of milk per day (roughly 8,000–11,000 litres per year), but the actual figure depends on breed, lactation stage, and management. Holsteins lead at 30–40 litres/day, Jerseys produce 15–25 litres/day with higher butterfat, and indigenous breeds like Sahiwal yield 7–14 litres/day. The table below gives you breed-by-breed benchmarks to compare against your herd.
Quick Answer: The global average milk production per cow is approximately 8,500 litres per year (~23 litres/day). In the US, the average is 11,066 litres per lactation (~30.4 litres/day over 305 days). Holstein-Friesian cows produce the most milk by volume, while Jerseys produce the richest milk with the highest butterfat (4.8–5.5%).
This guide breaks down milk production by breed with precise data, explains the factors that drive yield, and gives you the formulas to calculate your own herd's rolling average. We also compare Holstein vs Jersey economics and list 12 proven strategies to lift production.
Average daily milk yield by breed (comparison table)
The table below compares 10 major dairy breeds across daily yield, annual yield, butterfat, and protein. This is the data Google uses for featured snippets — pin it to your barn wall.
| Breed | Avg litres/day | Avg kg/lactation | Fat % | Protein % | Best climate |
|---|---|---|---|---|---|
| Holstein-Friesian | 30–40 | 9,000–12,700 | 3.6–4.0 | 3.1–3.4 | Temperate |
| Jersey | 15–25 | 5,700–9,500 | 4.8–5.5 | 3.7–3.9 | Temperate |
| Brown Swiss | 18–27 | 8,800–10,500 | 4.0–4.5 | 3.3–3.6 | Cool–temperate |
| Ayrshire | 16–22 | 8,500–9,200 | 3.8–4.0 | 3.1–3.5 | Temperate |
| Guernsey | 15–18 | 7,600–8,100 | 4.4–4.7 | 3.3–3.5 | Temperate |
| Milking Shorthorn | 15–22 | 7,500–9,600 | 3.7–4.0 | 3.3–3.4 | Temperate |
| Sahiwal | 7–14 | 1,350–2,750 | 4.8–5.1 | 3.2–3.5 | Hot arid |
| Gir | 5–10 | 900–2,700 | 4.5–5.0 | 3.2–3.5 | Hot tropical |
| Tharparkar | 8–12 | 1,500–2,200 | 4.0–4.5 | 3.2–3.4 | Hot arid |
| Red Sindhi | 8–14 | 1,700–3,400 | 3.9–4.5 | 3.2–3.5 | Hot tropical |
Source: USDA NASS 2025, Canadian Dairy Information Centre 2024, ICAR Guidelines, national dairy development boards.
Key takeaway: Holsteins dominate on volume, but Jerseys win on butterfat and protein concentration. If your processor pays by components, a smaller Jersey herd can match Holstein revenue on less feed.
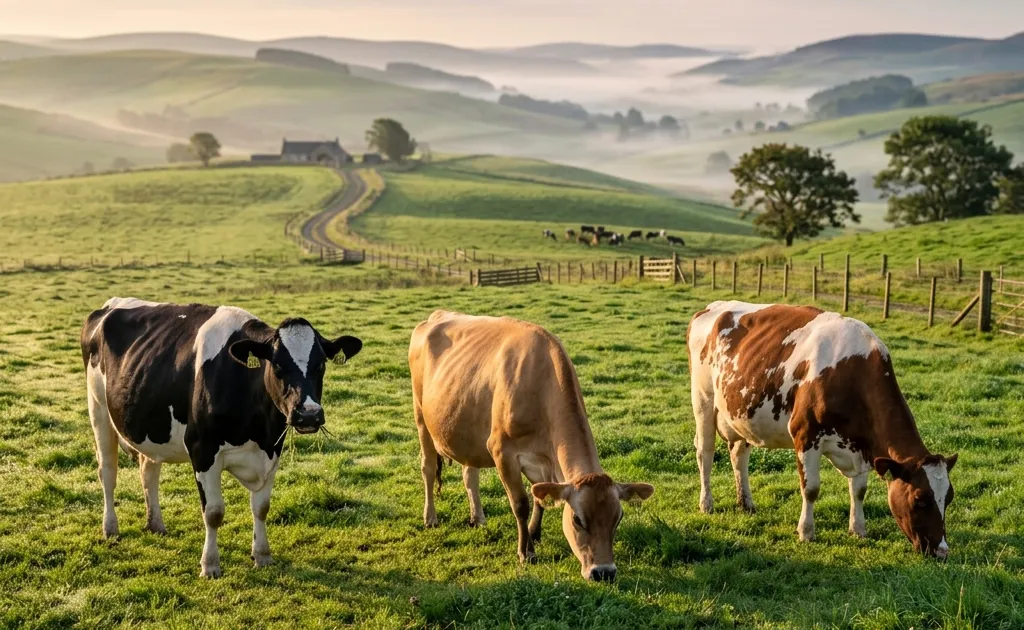
What affects milk production in dairy cows?
Milk yield is not just about genetics. Ten major factors determine whether your cows hit their breed potential or fall short.
1. Feed quality and nutrition
Nutrition is the single largest controllable factor. A lactating Holstein needs 24–28 kg of dry matter intake (DMI) per day to sustain 35+ litres. Energy density (NEL ≥ 1.65 Mcal/kg DM) and effective fibre (31–35% NDF) are critical. Protein amino acid balance — specifically methionine and lysine — limits milk protein yield more than total crude protein percentage.
- Energy: Rumen-fermentable carbohydrates drive propionate production, which is the primary glucose precursor for lactose synthesis
- Protein: metabolisable protein (MP) supply from rumen microbial protein + bypass protein determines amino acid availability
- Minerals: Calcium and phosphorus ratios affect milk fever risk; trace minerals (Se, Zn, Cu) influence immune function
- Water: cows drink 80–120 litres/day; water quality and availability directly affect intake and yield
2. Lactation stage and parity
Milk yield follows a predictable curve. It rises rapidly after calving, peaks at 40–90 days in milk, then declines 5–10% per month. Each pound of peak milk translates to approximately 200–250 additional pounds over the full 305-day lactation.
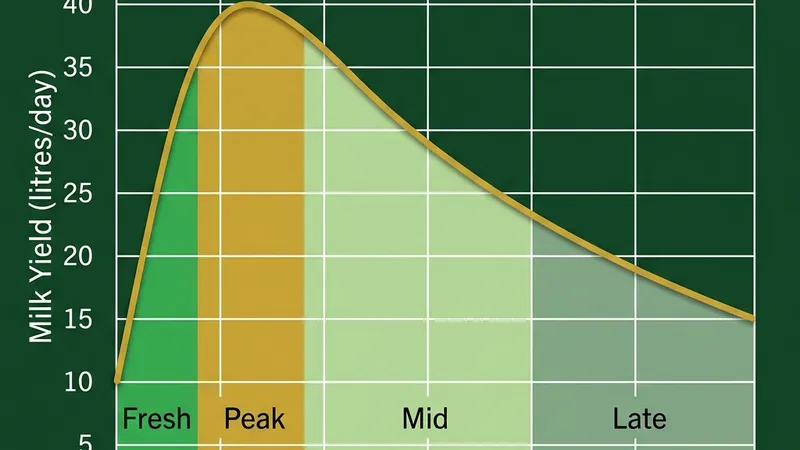
| Lactation stage | Days in milk | % of peak yield | Key management focus |
|---|---|---|---|
| Fresh/Early | 1–14 | 60–80% | Prevent metabolic disease; monitor intake |
| Peak | 40–90 | 100% (maximum) | Maximise DMI; avoid underfeeding |
| Mid-lactation | 91–200 | 85–95% | Maintain body condition; sustain persistency |
| Late lactation | 201–305 | 60–75% | Prepare for dry-off; manage BCS |
Parity (number of calvings) also matters. First-lactation heifers produce approximately 75–80% of their mature cow potential. Production typically peaks during the 3rd to 6th lactation, increasing roughly 25% over the first.
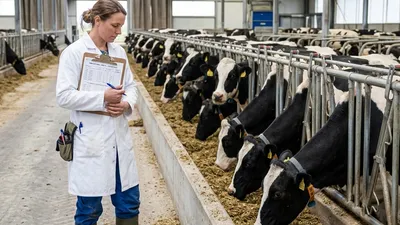
3. Health and somatic cell count
Subclinical mastitis is the silent yield thief. A somatic cell count (SCC) above 200,000 cells/mL indicates infection, and every 100,000 increase costs approximately 1.5 lbs (0.7 kg) of milk per cow per day. Clinical mastitis can slash yield by 10–25% in affected quarters.
| SCC level (cells/mL) | Status | Production impact |
|---|---|---|
| <100,000 | Uninfected | Full production potential |
| 100,000–199,000 | Borderline | Minimal loss; monitor closely |
| 200,000–400,000 | Subclinical mastitis | 15–33% of cows infected; ~3 kg/day loss |
| >400,000 | Clinical/chronic | >33% infected; ~5+ kg/day loss |
| >750,000 | Regulatory limit (US Grade A) | Milk may be condemned |
4. Breed genetics
Milk yield has a heritability of approximately 0.25–0.30, meaning 25–30% of the variation between cows is due to genetics. Genetic selection through artificial insemination (AI) with proven sires accounts for approximately 150 kg of additional production per year. Genomic testing of young stock accelerates genetic gain by identifying superior animals before first calving.
Track your herd's production data with our free IOFC Calculator to see which cows are generating the most income over feed cost.
How to calculate your herd's average milk yield
Two standard metrics are used in the dairy industry: the Rolling Herd Average (RHA) and the 305-day lactation yield. Here's how to calculate each.
Rolling Herd Average (RHA)
Worked Example: Calculating RHA for a 50-Cow Herd
Given Data
Calculation
Formula: RHA = (Total milk over 365 days) ÷ (Total cow-days) × 365
Include all cows — lactating, dry, and those that left the herd during the period. This gives the truest picture of herd performance.
305-Day Lactation Yield
Worked Example: Estimating 305-Day Yield from Test-Day Data
Given Data
Calculation
Formula: 305-day yield = Σ (test-day yield × interval days) adjusted for lactation length
For non-standard milking intervals, use ICAR's 24-hour yield correction: 24h yield = Actual yield × (24 ÷ actual interval hours). Example: 35 kg over 20 hours → 35 × 1.2 = 42 kg/day.
Want a faster way? Use our free Dairy Profit Calculator to input your test-day data and instantly see per-cow profitability alongside yield.
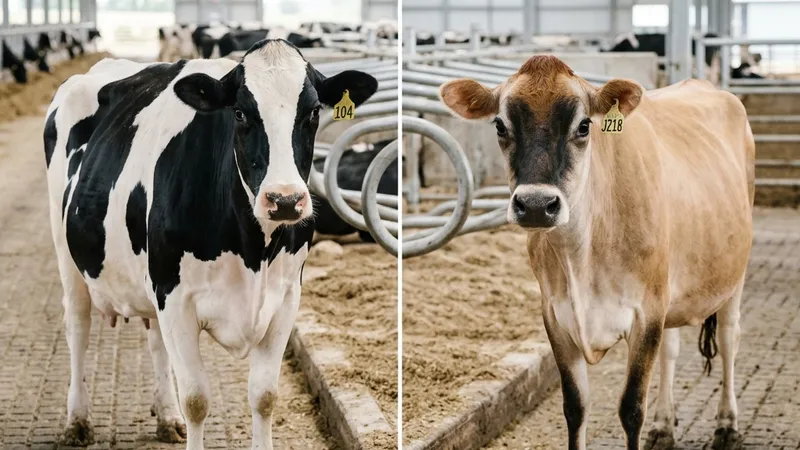
Holstein vs Jersey: which produces more value per litre?
The Holstein vs Jersey debate is not just about volume — it's about value per litre. Here's the head-to-head comparison:
| Factor | Holstein | Jersey | Advantage |
|---|---|---|---|
| Daily milk yield | 37 litres/day | 27 litres/day | Holstein +37% |
| Butterfat % | 3.85% | 4.92% | Jersey +28% relative |
| Protein % | 3.17% | 3.72% | Jersey +17% relative |
| Fat yield/year | ~514 kg | ~473 kg | Holstein +9% |
| Protein yield/year | ~424 kg | ~367 kg | Holstein +16% |
| Feed cost/kg DM | $0.27 | $0.23 | Jersey −15% |
| Feed efficiency (ECM/DM) | 1.67 | 1.75 | Jersey +5% |
| Cheese yield/100 lbs milk | ~10.5 lbs | ~13.0 lbs | Jersey +24% |
Worked Example: Revenue Comparison — Michigan State University Study
Holstein Herd
Jersey Herd
Verdict (Michigan State Study): Holsteins were $456 more profitable per cow per year than Jerseys across three commercial dairies. 77% of the Holstein advantage came from producing ~810 additional pounds of components annually. However, Jerseys were more feed-efficient (1.75 vs 1.67 lb ECM/lb DM).
Break-even: If Holstein production stays constant, Jerseys need to reach ~31 litres/day (70 lbs) to match Holstein profitability. Source: Shonka-Martin et al., Journal of Dairy Science, 2019; Michigan State University Extension, 2022.
Industry benchmarks: is your herd above or below average?
Use these benchmarks to compare your herd's performance against national and global standards:
| Benchmark | Value | Source |
|---|---|---|
| Global average milk/cow/year | ~8,500 litres | FAO/OECD 2024 |
| US average milk/cow/year (2025) | 11,066 kg (~11,000 L) | USDA NASS |
| US average fat % | 4.32% | USDA NASS 2025 |
| US average protein % | ~3.1–3.2% | Industry average |
| Top Holstein herds (305-day) | >12,700 kg | Holstein Association USA |
| Top Jersey herds (305-day) | >9,500 kg | American Jersey Cattle Association |
| Healthy SCC target | <200,000 cells/mL | ICAR / AHDB UK |
| Optimal peak milk (Holstein) | 45–55 litres/day | University Extension data |
How to read this: If your Holstein herd averages 9,000 kg per lactation, you're below the US average of 11,066 kg. This gap represents approximately $1,200–$1,800 per cow per year in lost revenue (at $3.50–$5.00 per 100 kg milk).
Convert Milk Prices
Instantly convert between $/cwt, $/gallon, and liters across multiple currencies.
How to improve low milk yield in your herd
If your herd is below breed benchmarks, these 12 strategies — ranked by impact — will close the gap:
Optimise the dry period
Target 45–60 days dry with BCS 3.0–3.25 at calving. Too short a dry period (<40 days) reduces next lactation yield by 10–15%. Too long (>70 days) increases mastitis risk.
Transition cow management
Run a dedicated fresh cow group for 14–21 days post-calving. Monitor temperature, appetite, and discharge. Fresh cows that don't eat within 24 hours are 3× more likely to develop ketosis, reducing peak yield by 15–20%.
Maximise peak milk
Every 1 kg of peak milk = approximately 200–250 kg over the full lactation. Push energy density in early lactation — use propylene glycol, niacin, and rumen-protected fats to support glucose supply without overwhelming rumen pH.
Control subclinical mastitis
Implement monthly bulk tank SCC monitoring. Target <200,000 cells/mL. Use selective dry cow therapy based on individual cow SCC history. Every 100,000 cells/mL increase above 200,000 costs ~0.7 kg milk/cow/day.
Increase milking frequency
Switching from 2× to 3× daily milking increases yield 12–15%. Automated milking systems (AMS) allow on-demand milking 2.5–3.2× daily, boosting yield while improving cow comfort.
Heat stress abatement
When Temperature-Humidity Index (THI) exceeds 68, milk yield drops 0.2–0.4 kg/cow/day per THI unit above threshold. Install fans (minimum 1,500 CFM per stall), soakers, and shade structures. Cooling cows pre- and post-milking is as important as cooling in the barn.
Feed management
Use TMR (Total Mixed Ration) to prevent sorting. Push up feed 8–12× daily. Provide 30–36 inches of bunk space per cow. Fresh feed should be available 22+ hours/day. Clean water within 50 feet of feed bunk.
Improve genetics through AI
Use sexed semen on the top 40% of heifers and proven sires with high PTA for milk, fat, and protein. Genomic testing of young stock identifies carriers of genetic defects and ranks animals for breeding decisions. Genetic gain adds ~150 kg/year.
Use feed additives strategically
Ionophores (monensin) improve feed efficiency 3–5%. Rumen-protected choline supports liver function in transition cows. Yeast cultures stabilise rumen pH. Biotin supplementation improves hoof health, reducing lameness-related production losses.
Reproductive management
Maintain calving intervals of 12.5–13 months. Cows that spend more time in early lactation produce more lifetime milk. Anestrous cows (>80 days post-calving without heats) cost $6–$10/day in lost production potential.
Monitor and cull strategically
Track individual cow data monthly. Cull cows with chronically high SCC (>500,000), repeat breeders (>3 services), and consistently low producers (below herd average −20%). Low producers consume similar feed but return significantly less revenue.
Stocking density and cow comfort
Target 80–85% stocking density in fresh cow pens. Provide at least 120 sq ft per cow in free-stall housing. Comfortable cows lie down 12–14 hours/day, and each additional hour of lying time adds ~1 kg of milk.
After implementing these strategies, track your results with our free IOFC Calculator and Profit Calculator to measure the financial impact of each improvement.
Milk yield calculator
Select your breed and enter your daily yield to instantly see annual production, component estimates, and whether your herd is above or below the breed average.
FAQ
How much milk does a cow produce per day in litres?
A typical dairy cow produces 25–30 litres per day, but this varies significantly by breed. Holsteins average 30–40 litres/day, Jerseys produce 15–25 litres/day with higher butterfat, and indigenous zebu breeds like Sahiwal produce 7–14 litres/day. Peak production occurs 40–90 days after calving.
What breed of cow produces the most milk?
Holstein-Friesian cows produce the most milk by volume, averaging 9,000–12,700 kg per 305-day lactation (30–40 litres/day). However, Jersey cows produce milk with 28% more butterfat and 17% more protein per litre, making them more profitable in component-priced markets.
How do I increase milk production in my dairy cows?
The most effective strategies include: optimising transition cow nutrition (target BCS 3.0–3.25 at calving), increasing milking frequency from 2× to 3× daily (yields 12–15% more), maintaining SCC below 200,000 cells/mL, providing heat stress abatement in summer, and using AI with genetically superior sires.
How many litres of milk does a cow produce in a year?
The global average is approximately 8,500 litres per cow per year. In the US, the average is 11,066 kg (about 11,000 litres) per lactation. Top-performing Holstein herds exceed 12,700 kg per 305-day lactation, while Jerseys average 5,700–9,500 kg.
What is the average milk yield per cow per day in India?
In India, the national average milk yield is approximately 7–8 litres per day across all breeds. High-producing crossbred cows can yield 15–25 litres/day, while indigenous breeds like Gir, Sahiwal, and Tharparkar average 5–14 litres/day depending on management and feeding practices.
Does milk production decrease after a certain number of lactations?
Milk production typically peaks during the 3rd to 6th lactation, increasing approximately 25% over the first lactation. After the 6th lactation, production gradually declines due to reduced udder capacity and reproductive efficiency, though well-managed cows can remain productive for 8–10 lactations.
Calculate Your Herd's Performance
Now that you know the benchmarks, use our free calculators to see where your herd stands. Track Income Over Feed Cost, calculate profit per cow, and plan your breeding calendar — all in one place.
Open All CalculatorsReferences
- USDA NASS. Milk Production Report, February 2026. National Agricultural Statistics Service.
- FAO/OECD. Dairy Market Outlook 2024–2034. Food and Agriculture Organization.
- International Dairy Federation (IDF). World Dairy Situation Report 2025.
- ICAR. International Agreement on Recording of Dairy Performance: Section 2 — Milk Recording Calculations.
- Holstein Association USA. Holstein Breed Facts and Statistics. 2025.
- American Jersey Cattle Association. Jersey milk production records 2024–2025.
- Canadian Dairy Information Centre. Breed average milk production statistics 2024.
- AHDB Dairy UK. Somatic Cell Count Guidelines and Benchmarks. 2025.
- University of Minnesota Extension. Peak Milk and Its Impact on Lactation Yield.
- University of Wisconsin Extension. Heat Stress and Milk Production in Dairy Cattle.
- National Animal Disease Center (NADC). Mastitis and Somatic Cell Count Research. USDA-ARS.