In the United States, dairy farming is a high-tech, highly optimized industry. While states like California and Wisconsin are famous for their massive total milk volume, the rankings for efficiency and yield per cow tell a different story. Let's explore the data behind the highest-producing states in 2026.
Quick Answer: Highest Milk Production Per Cow by US State
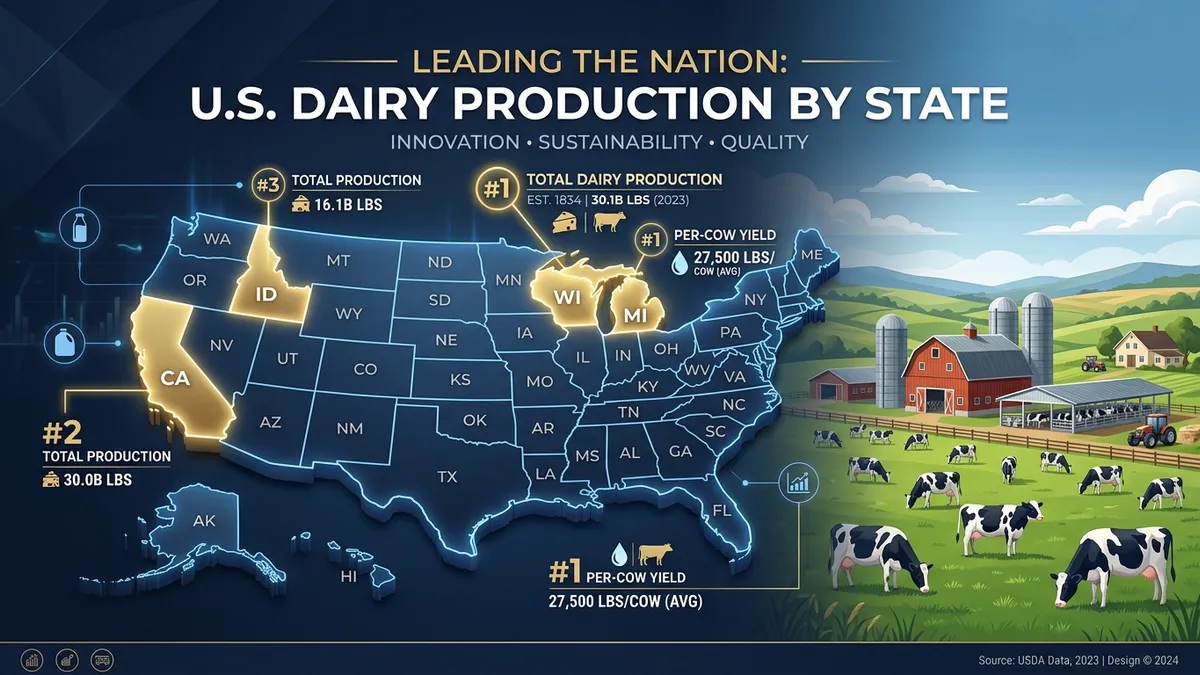
Michigan ranks #1 in US milk production per cow at roughly 27,700 lbs/cow/year, followed by Texas (~26,200 lbs) and Colorado (~26,000 lbs). The US national average is over 24,000 lbs (≈11,000 kg) per cow annually — driven by advanced genetics, precision nutrition, and climate-controlled housing.
Overview: US Average Milk Yield
The US average milk production per cow continues to impress on the global stage, sitting at over 24,000 lbs (approx. 11,000 kg) per cow annually. This remarkable figure isn't an accident. It is driven by decades of focused breeding for superior genetics, precision nutrition formulated by expert dairy nutritionists, and the widespread adoption of farm management technology.
To see how this stacks up against other countries and specific breeds, check out our milk production per cow by country rankings, the Holstein Milk Production Guide, our pillar page on average milk production per cow, or the regional deep dives for India and Pakistan.
Top 10 States by Yield per Cow
It's crucial to understand the difference between total volume and yield per cow. California produces the most milk total, but when we look at per-cow efficiency, the Midwest and West lead the charge. The rankings below reflect the latest USDA NASS state-level data.
| Rank | State | Avg Annual Yield (lbs/cow) | Key Driver |
|---|---|---|---|
| 1 | Michigan | ~27,700 | Ideal climate, advanced management |
| 2 | Texas | ~26,200 | Large consolidated herds, dry climate |
| 3 | Colorado | ~26,000 | Large modern facilities, cross-ventilated barns |
| 4 | New York | ~25,800 | Strong forage base |
| 5 | Wisconsin | ~25,600 | Deep dairy heritage, quality feed |
| 6 | Idaho | ~25,600 | Massive scale, feed availability |
| 7 | Nevada | ~25,500 | Dry climate, large desert dairies |
| 8 | Iowa | ~24,800 | Abundant grain supply |
| 9 | New Mexico | ~24,700 | Large confinement operations |
| 10 | Nebraska | ~24,700 | Feedlot-dairy integration, scale |
Source: USDA NASS Milk Production state summaries (latest available data, rounded).
Factors Driving Regional Differences
Why does a cow in Michigan produce over 3,500 more pounds of milk than the national average? It comes down to four primary factors:
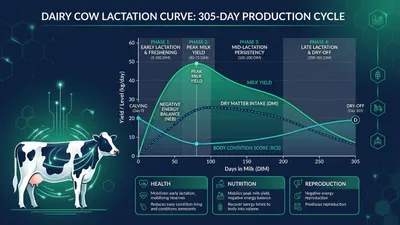
- Climate: Heat stress severely limits milk production. States with cooler summers or dry heat (where evaporative cooling works well) have higher yields. The deep South struggles with high heat and humidity, which lowers dry matter intake and milk yield.
- Forage Availability & Quality: The Midwest (like Michigan and Wisconsin) has access to phenomenal corn silage and alfalfa, providing high-energy, highly digestible rations.
- Breed Composition: States like Texas and California have seen a massive increase in the Jersey cow population. Jerseys produce less total fluid volume but higher fat and protein. Read our Jersey Milk Production Guide to learn why this is profitable.
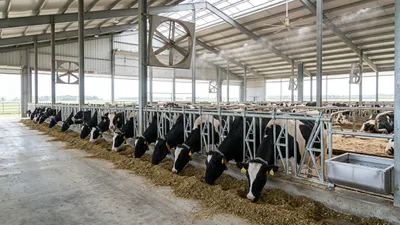
- Herd Size & Facilities: Modern cross-ventilated barns in states like Colorado provide a 24/7 climate-controlled environment, allowing cows to reach maximum genetic potential regardless of the weather outside.
The Consolidation Trend
The US dairy industry is rapidly changing. Farms are getting larger, and the geographical center of dairy is moving West and Southwest. States like Idaho, Texas, and Colorado are seeing massive growth in herd sizes due to more favorable regulatory environments and wide-open spaces for large-scale operations.
Are you tracking your farm's performance? Use our DMC Calculator to estimate your margins or check out the latest US Milk Price Database to see how prices affect profitability.
How to Benchmark Your Herd Against State Averages
Seeing a state average of 25,000+ lbs is only useful if you know where your own herd stands. Here is how to turn these rankings into an actionable benchmark:
| Herd Tier | 305-Day Yield (lbs/cow) | What It Signals |
|---|---|---|
| Below Average | < 22,000 | Likely gaps in nutrition, health, or genetics. |
| National Average | ~24,000 | Solid management; room to optimize components. |
| Top-State Level | 25,500–26,500 | Good genetics + nutrition + cow comfort. |
| Elite (Michigan/Texas top) | 27,000+ | Genomic genetics, TMR, cross-ventilated housing. |
- Get your rolling herd average (RHA): Pull your 305-day mature-equivalent milk per cow from your herd-management software or last DHI test.
- Compare to your state, then your region: A 22,000-lb herd is below the national 24,000-lb average but may be typical for a pasture-based operation in the Southeast. Compare against systems similar to yours, not just the national leader.
- Identify the gap driver: If you trail benchmarks, the cause is usually one of four things — DMI/transition management, heat stress, herd health (SCC), or genetics. Isolate which before investing.
- Set a realistic target: Top states achieve 27,000+ lbs through a combination of genetics, nutrition, and climate control. Closing your gap by even 2,000 lbs/cow is worth significant revenue across a herd.
Use our Milk Yield Calculator to project herd output and our Dairy Profit Calculator to translate higher yield into margin.
The management practices behind these high-yielding states — optimized DMI, transition-cow care, 3× milking, and heat-stress control — are the same levers covered in our guide to increasing milk production. For the global context, compare these state figures against international yields, and see how breed composition — especially the Jersey's rise — shapes state-level numbers in our Holstein production guide.
Frequently Asked Questions
Which US state produces the most milk per cow?
Michigan consistently ranks #1 in average milk production per cow, often exceeding 27,000 lbs per cow annually. This is driven by advanced management, high-quality forage, and favorable climate.
Why does Michigan have the highest milk yield?
Michigan benefits from an ideal climate with cool summers that reduce heat stress, access to excellent Great Lakes fresh water, and a strong history of adopting advanced dairy genetics and nutrition management.
Is California the best state for milk production per cow?
While California is the #1 state for total milk volume, it is not the highest for per-cow yield. This is due to a larger percentage of Jersey cows (which produce less volume but higher fat/protein) and more heat stress.
How much milk does the average US cow produce?
The US average is over 24,000 lbs (approximately 11,000 kg) per cow annually. This number continues to climb year over year thanks to improvements in dairy genetics, nutrition, and technology.
Why is dairy farming moving west and southwest in the US?
Dairy expansion has shifted west and southwest (to states like Idaho, Texas, and Colorado) due to more favorable regulatory environments, available land for large-scale operations, and dry climates that are easier for managing large herds.