When examining the global dairy industry, a fascinating dichotomy emerges between nations that produce the most total milk and the nations that achieve the highest efficiency per individual animal. Understanding milk production per cow by country provides crucial insights into global agricultural economics, technological adoption, and farming methodologies.
Quick Answer: Milk Production Per Cow by Country
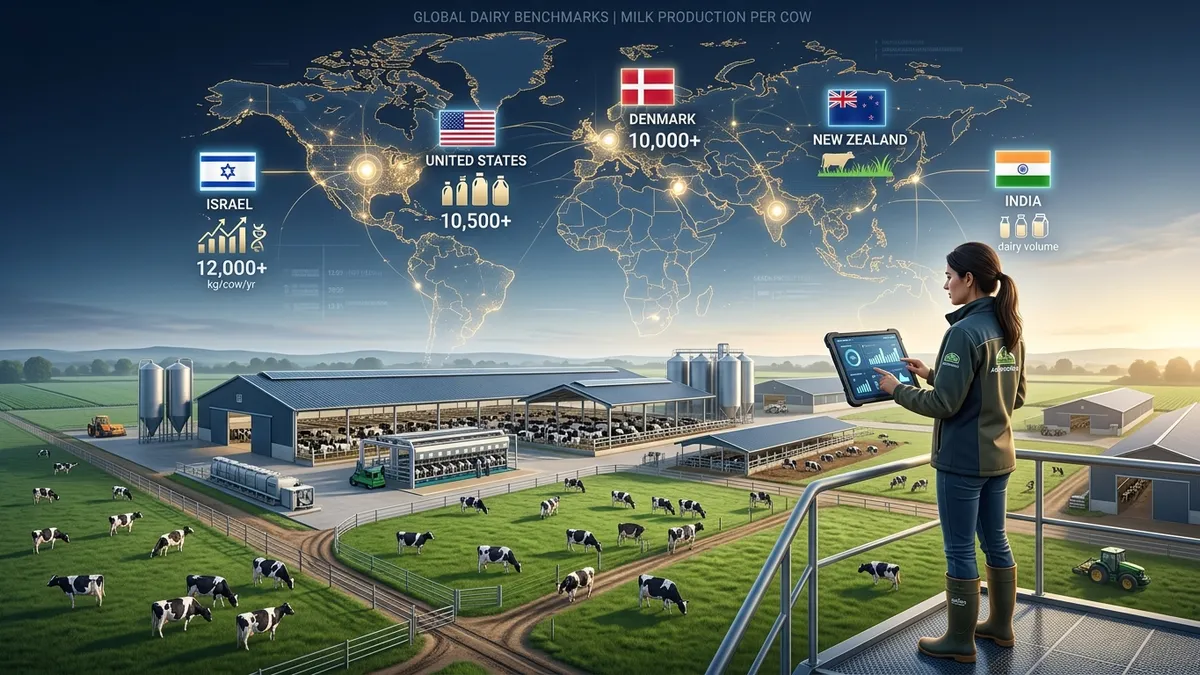
Israel leads the world in milk production per cow at roughly 12,265 kg/year, followed by the USA (~11,000 kg), Denmark, and Canada. India is the largest producer by total volume (~230 million tonnes) but has one of the lowest per-cow averages (~1,800 kg/year). New Zealand (~4,200 kg/cow) runs a low-cost pasture system that is highly profitable despite lower yields.
Get dairy management tips weekly
Join 200+ dairy farmers getting practical KPIs, breeding insights, and profitability tips — no spam, unsubscribe anytime.
1. Introduction — Volume vs Efficiency: Two Very Different Rankings
The global dairy landscape is defined by two distinctly different metrics: total national volume and efficiency per cow. If you look strictly at the total volume of milk produced annually, the list is dominated by vast, populous nations with massive agricultural landbases and enormous national herds, such as India and the United States.
However, when you divide that total volume by the number of lactating animals, the rankings flip entirely. The highest milk production per cow is often found in smaller, highly technologically advanced nations that face land or water scarcity, forcing them to maximize the output of every single animal. In these efficiency-driven markets, the focus shifts to advanced genetics, precision nutrition, and highly controlled indoor environments.
This article breaks down the latest FAO and USDA agricultural data to determine exactly which countries lead the world in individual cow yields, which lead in sheer volume, and the underlying technological, environmental, and genetic factors that drive these massive disparities. From the high-tech, climate-controlled barns of Israel to the sweeping green pastures of New Zealand and the vast smallholder networks of India, the story of global milk production is as diverse as the geographies it spans.
2. Top 10 Countries by Milk Yield Per Cow
The table below highlights the world leaders in dairy cow efficiency. These nations have invested heavily in genetic selection—primarily utilizing the Holstein breed—and employ intensive Total Mixed Ration (TMR) feeding protocols to unlock the maximum biological potential of their herds.
| Rank | Country | Average Yield Per Cow (kg/year) | Primary Farming System |
|---|---|---|---|
| 1 | Israel | ~12,265 | Intensive TMR, Climate-Controlled Confinement |
| 2 | USA | ~11,000 (24,390 lbs) | Large-Scale TMR, Free-Stall/Dry Lot |
| 3 | Denmark | ~10,600 | Intensive TMR, Free-Stall Housing |
| 4 | Canada | ~10,300 | Intensive TMR, Supply-Managed |
| 5 | Netherlands | ~9,800 | Intensive TMR, Precision Tech Integration |
| 6 | Sweden | ~9,600 | Intensive Indoor, High Animal Welfare Stds |
| 7 | Germany | ~8,800 | Mixed Intensive / Semi-Intensive |
| 8 | France | ~8,700 | Mixed TMR and Grazing |
| 9 | United Kingdom | ~7,800 | Mixed Confinement and Grazing |
| 10 | Ireland | ~7,600 | Pasture-Based with Winter TMR |
It is important to note the staggering gap between the top tier and the rest of the world. An average dairy cow in Israel or the United States produces more milk in a single year than five to seven average cows in India or Pakistan. In the USA specifically, recent USDA data shows cows averaging roughly 65 lbs (about 30 kg) of milk per day, maintaining that rate across millions of animals to reach over 11,000 kg per year.
3. Top 5 Countries by Total Milk Volume
While efficiency is critical for farm-level profitability in high-cost regions, total volume dictates global food security and commodity market influence. The ranking for total raw milk output looks significantly different.
| Rank | Country | Total Volume (Million Tonnes/Year) | Key Characteristics |
|---|---|---|---|
| 1 | India | ~230 | Massive national herd, reliant heavily on buffaloes (Murrah) and indigenous cattle, millions of smallholder farmers. |
| 2 | USA | ~100 | Highly consolidated commercial farms, massive herd size per farm, incredibly high yield per animal. |
| 3 | Pakistan | ~65 (Est)* | Similar smallholder structure to India, heavily reliant on buffalo milk, high domestic consumption. |
| 4 | China | ~42 (Est) | Rapidly expanding mega-dairies, massive government investment in importing genetics and building infrastructure. |
| 5 | Brazil | ~36 | Vast agricultural lands, transitioning toward commercial crossbreeds (Girolando) to boost tropical yields. |
*Estimates vary based on inclusion of informal market production and buffalo milk totals.
India produces nearly a quarter of the world's milk. Their dairy sector is a triumph of cooperative organizing—most famously the Amul model—which aggregates milk from tens of millions of smallholder farmers who typically own just 1 to 5 animals. The United States holds a comfortable second place, achieving half of India's output but doing so with a fraction of the cow population, highlighting the stark contrast in production methodologies.
4. Why Does Israel Lead the World in Yield Per Cow?
Producing over 12,265 kg of milk per cow annually in a desert climate seems counterintuitive. Yet, Israel has dominated global yield per cow metrics for years. The success of the Israeli dairy sector rests on a foundation of intense necessity; with severely limited arable land and water resources, inefficiency is not economically viable.
The cornerstone of this success is the Israeli Holstein. Through decades of relentless, centralized data collection by the Israeli Dairy Board, breeders have selected for genetics that not only maximize milk output but specifically thrive in hot, arid conditions. This genetic mastery is paired with unparalleled herd management technology. Israeli farms are highly digitized. Cows wear advanced biometric collars and pedometers that monitor rumination, activity, and temperature in real-time, allowing farmers to detect illnesses days before clinical signs appear.
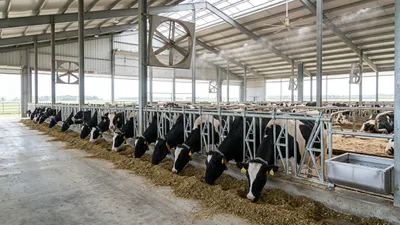
Furthermore, climate control is absolute. To combat the severe heat, which naturally depresses milk yield, Israeli barns utilize sophisticated arrays of fans, misters, and automated shower systems that cool the cows precisely when their core temperatures begin to rise. Nutrition is formulated down to the gram, ensuring that the heavy metabolic toll of producing 40+ liters of milk a day is met with exact macronutrient support.
5. The Pasture-Based Model: New Zealand's Efficient Low-Cost System
Looking at the table, New Zealand's yield of ~4,200 kg per cow per year might seem unimpressive compared to the 10,000+ kg yields of Europe and North America. However, evaluating New Zealand's dairy sector purely on yield misses the genius of their economic model.
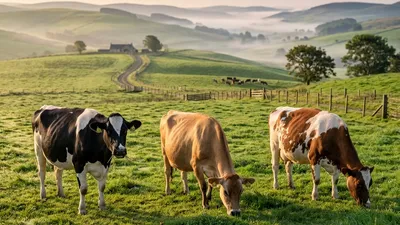
New Zealand operates the world's most successful pasture-based grazing system. Rather than housing cows in expensive concrete barns and hauling harvested, processed grain and forage to them, New Zealand farmers let the cows harvest their own feed. Cows graze on high-quality ryegrass and clover pastures year-round. This system drastically reduces the primary overhead costs of dairy farming: feed, housing infrastructure, and fuel.
Because they rely on the natural growth curve of pasture grass, New Zealand dairies operate on a strict seasonal calving schedule. The cows calve in the spring when grass growth is explosive, and they are dried off in the winter when grass growth slows. While the individual cow yields less milk, the cost to produce every liter is significantly lower than in a TMR confinement system. This extreme cost efficiency is what allows New Zealand, a small island nation, to be the dominant powerhouse in global dairy commodity exports.
6. The European Leaders: Denmark, Netherlands & Sweden
While Israel tops the global charts, European dairy producers—specifically in the Nordic belt and the Low Countries—form the densest cluster of high-efficiency milk production in the world. Denmark averages an extraordinary 10,571 kg per cow per year, closely followed by the Netherlands (~9,800 kg), Sweden (~9,600 kg), and Germany (~8,800 kg).
What explains northern Europe's dominance? The European model combines strict regulatory compliance with aggressive technological adoption:
- Nordic Total Merit (NTM) Genetics: Denmark, Sweden, and Finland collaborate under the VikingGenetics framework using the NTM index. Unlike historical breeding indexes that prioritized raw fluid yield at the expense of cow longevity, NTM heavily weights udder health, hoof health, calvability, and metabolic resilience alongside milk solids. This results in cows that achieve 10,000+ kg yields across 4 to 5 lactations rather than burning out after two.
- Robotic Milking (AMS) Density: The Netherlands and Scandinavian nations have the highest per-capita adoption of Automated Milking Systems (AMS/Robots) in the world. Robotic milking allows cows to be milked 2.7 to 3.2 times daily on voluntary traffic, boosting milk synthesis by 10–15% compared to conventional twice-daily milking parlors while tracking individual milk conductivity and somatic cell counts at every quarter.
- High-Sugar Forage Management: Northern Europe's cool maritime climate allows for multi-cut perennial ryegrass silage systems. European dairymen harvest grass at vegetative stages (every 4–5 weeks), achieving dry matter digestibility (DMD) above 75% and protein levels of 18–20%, reducing the need for imported concentrate feeds.
7. The Developing World Gap: India, Pakistan & Brazil
In developing nations like India (around 1,800 kg/year per animal) and Pakistan (around 1,200 kg/year), the dairy landscape is vastly different. The industry is predominantly composed of smallholder farmers managing small, mixed herds of indigenous cattle and water buffaloes. For a closer look at these markets, see our milk production per cow in India and milk production in Pakistan deep dives.
The lower yields are primarily a function of genetics and nutrition. Indigenous breeds (like the Sahiwal or Gir) are genetically adapted to survive extreme heat, tick-borne diseases, and periods of scarce forage. They are dual-purpose survivors, not fragile, high-yielding biological milk machines like the Holstein. Additionally, these animals are often fed on agricultural byproducts and marginal grazing rather than scientifically formulated, energy-dense TMR rations.
Brazil (~2,400 kg/year) represents a transition zone. Recognizing the need to improve yields while maintaining tropical resilience, Brazilian breeders developed the Girolando—a cross between the high-yielding Holstein and the hardy, tick-resistant Gir. This genetic innovation is rapidly driving Brazil's average yields upward, modernizing their industry without sacrificing the necessary environmental adaptations.
8. Global Economics: Feed Cost vs Yield Efficiency
In dairy farming, higher yield does not automatically equate to higher profitability. The true economic benchmark is Income Over Feed Cost (IOFC) and the total cost of production per hundredweight (cwt / 45.36 kg) or per 100 liters of milk. When you analyze global dairy systems through an economic lens, the efficiency equation becomes far more nuanced:
| Country / System | Primary Model | Avg. Yield (kg/yr) | Est. Feed Cost (% of Revenue) | Key Competitive Advantage |
|---|---|---|---|---|
| Israel | Indoor Confinement TMR | 12,265 | 55% – 62% | Maximal milk per unit of land and water |
| United States | Large-Scale Confinement TMR | ~10,500 | 48% – 55% | Enormous grain production & scale efficiencies |
| Denmark / Netherlands | Intensive TMR + AMS | 9,800 – 10,500 | 50% – 58% | High milk solids & automated labor efficiency |
| New Zealand | Pasture Grazing (Seasonal) | ~4,200 | 28% – 38% | Lowest cost of production; global export dominance |
| India (Commercial A2) | Semi-Intensive Indigenous | 2,500 – 3,500 | 35% – 45% | Retail price premium (1.5x–2x) for pure A2 milk |
While Israeli and American dairies generate massive gross output, their break-even price per liter is significantly higher due to heavy capital investment in machinery, climate control, and grain feed. Conversely, New Zealand can withstand global dairy price crashes that would bankrupt confinement operations because their feed cost per liter is a fraction of their competitors'.
For individual producers, the takeaway is clear: do not blindly chase national yield averages. Measure your own operational margins using our IOFC Calculator and Milk Yield Calculator to determine the optimal production level for your specific feed costs and regional milk pricing structure.
9. What Drives the Yield Gap Between Nations?
The variance in milk production per cow by country—ranging from 1,200 kg to over 12,000 kg—is not random. It is driven by a combination of technological, structural, and genetic factors:
- Genomic Selection and Breed Choice: High-yielding countries use almost exclusively Holstein genetics, meticulously selected through genomic testing to pass on traits for massive milk volume, udder conformation, and feed efficiency.
- Total Mixed Ration (TMR) Feeding: Achieving 10,000+ kg yields requires incredible energy intake. TMR systems blend forages, grains, proteins, and minerals into a perfectly uniform diet, preventing cows from sorting their feed and ensuring maximum nutrient absorption.
- Climate Control Infrastructure: Heat stress severely limits milk production. High-yield nations invest heavily in barns equipped with automated fans, shade structures, and evaporative cooling systems.
- Herd Health and Veterinary Care: Intensive production requires intensive health management. Regular veterinary oversight, automated mastitis detection in milking parlors, and strict biosecurity keep high-yielding cows healthy.
- Farm Consolidation: As farm sizes increase (as seen in the USA), they achieve economies of scale that allow for the purchase of advanced technology (like robotic milkers or rotary parlors) that smaller farms simply cannot afford.
Ultimately, no single system is universally "better." Israel’s high-input, high-output model works perfectly for its geography, just as New Zealand’s low-input grazing model works for its climate. The global dairy industry remains a complex tapestry of localized solutions meeting a massive, unified global demand.
To see how individual breeds drive these national numbers, read our Holstein production guide and Jersey production guide. For regional deep dives, explore US state rankings, milk production in India, and milk production in Pakistan.
Frequently Asked Questions
Which country has the highest milk production per cow?
Israel has the highest milk production per cow globally, averaging approximately 12,265 kg per cow per year. This incredible yield is driven by the Israeli Holstein breed, advanced climate-controlled housing, precision nutrition, and extensive genomic data management.
What is the average milk production per cow in the USA?
In the United States, the average milk yield per cow exceeds 10,000 kg per year. According to USDA data, cows average about 60 to 65 pounds of milk per day, which translates to a highly efficient year-round production driven by TMR feeding and advanced genetics.
Which country produces the most milk in total volume?
India is the number one global producer of milk by total volume, producing approximately 230 million tonnes annually. However, this is achieved through an immense population of cattle and buffaloes, not through high individual cow yields, as the national average per animal is only about 1,800 kg per year.
Why does New Zealand have lower milk yields per cow compared to Europe and North America?
New Zealand operates primarily on a pasture-based grazing system rather than the Total Mixed Ration (TMR) confinement systems used in the US or Europe. While their yield per cow is lower (around 4,200 kg/year), their cost of production is also much lower, making them highly profitable and competitive on the global export market.
How is climate affecting milk yields globally?
Heat stress is a major factor limiting milk yields, particularly in developing nations in tropical climates like India, Pakistan, and Brazil. Conversely, countries like Israel have invested heavily in cooling infrastructure (fans, sprinklers, shaded barns) to maintain high yields despite extreme heat.
What is the role of genetics in increasing milk yield?
Genetics account for a massive portion of the yield gap. Top-producing countries rely heavily on genomic selection, specifically utilizing high-yielding Holstein lineages. Developing nations often rely on dual-purpose indigenous breeds or crossbreeds, which are hardier but naturally possess lower milk production potential.