Get dairy management tips weekly
Join 200+ dairy farmers getting practical KPIs, breeding insights, and profitability tips — no spam, unsubscribe anytime.
1. What is the Lactation Curve?
Quick Answer
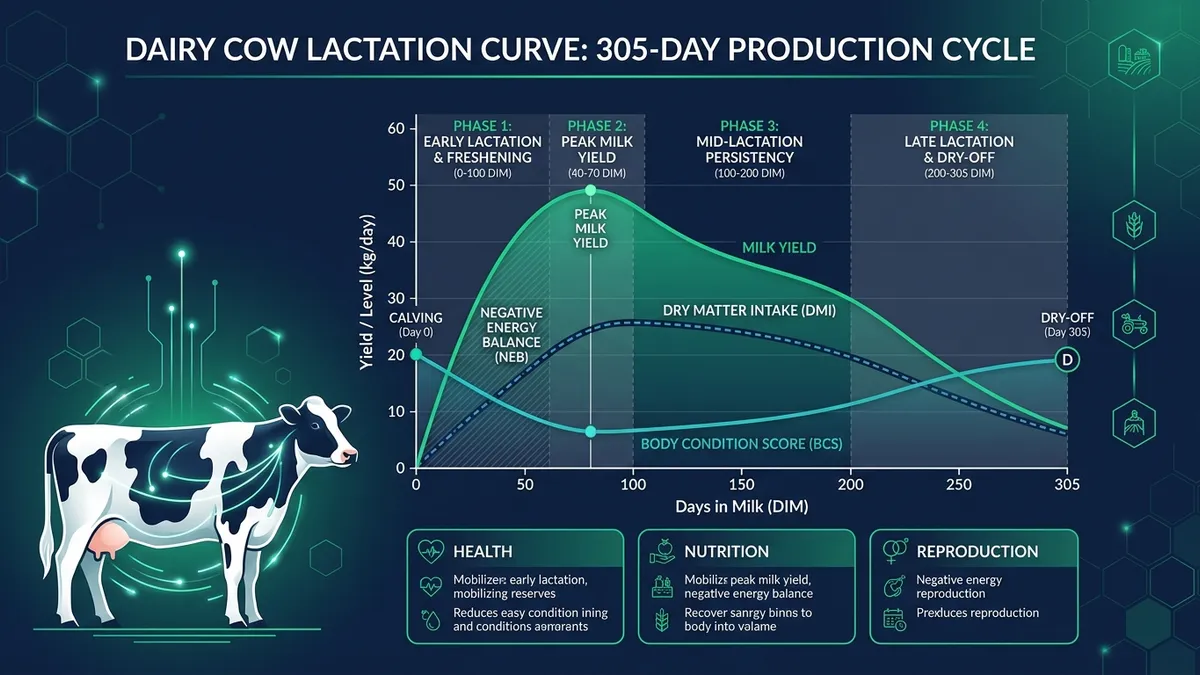
The lactation curve is a graphical representation of a dairy cow's milk yield over the course of her milking period. It maps daily milk production from calving day (0 Days in Milk, or DIM) through peak production, into gradual decline, and finally to the dry off period. Understanding this curve allows farmers to optimize nutrition, anticipate health challenges, and forecast profitability.
For modern dairy farmers, the lactation curve is far more than just a line on a graph—it is the heartbeat of farm profitability. A perfectly managed lactation curve ensures that a cow meets her genetic potential for milk production while maintaining reproductive efficiency and metabolic health. As profit margins in the dairy industry tighten, understanding and optimizing the lactation curve for every animal in your herd becomes an essential requirement for long-term financial sustainability.
Every lactation curve starts when a cow calves and enters the milking string. As her body adjusts to the demands of milk synthesis, production rapidly scales upward. However, this physiological marathon places extraordinary demands on her body. The dairy cow is unique in her ability to mobilize vast amounts of body reserves to fuel this initial spike in production. This biological feat requires a robust nutritional foundation, meticulous management, and constant monitoring to prevent the cow from crashing under her own potential.
By mapping out the trajectory of milk output over a standard 305-day period, farmers can compare individual cows against herd averages, benchmark first-lactation heifers against mature cows, and identify the subtle signs of subclinical disease before they manifest as severe health events. While modern genetics have vastly improved peak yields over the last several decades, the fundamental shape of the biological curve remains a central focus of daily management. It provides a daily report card on your transition program, your forage quality, and your overall herd health management strategy.
2. The 4 Phases Explained
The standard lactation cycle of a dairy cow is typically divided into four distinct phases, each defined by Days in Milk (DIM) and specific physiological changes. Properly managing a cow requires distinct strategies for each phase, as the cow's body undergoes massive metabolic shifts across these 305 days.
Early Lactation (0–100 DIM)
Early lactation is undeniably the most critical and metabolically demanding phase of a cow's productive cycle. During this period, milk output rises dramatically, peaking around 40 to 70 DIM. However, dry matter intake (DMI) lags significantly behind the rapidly increasing energy demands of milk synthesis. The rumen requires time to expand and adapt to high-energy lactating rations after the dry period.
Because the cow cannot eat enough to fuel her production, she enters a state of Negative Energy Balance (NEB). During NEB, the cow's metabolic system begins mobilizing her own body fat reserves to make up for the energy deficit. While this is a natural biological mechanism perfected by generations of selective breeding, excessive weight loss can lead to devastating metabolic disorders such as ketosis or fatty liver disease. Nutritional management during this phase must focus intensely on high-quality, energy-dense forages, rumen-protected fats, and careful monitoring of Body Condition Score (BCS). A cow losing more than 0.5 to 1.0 point of BCS (on a 5-point scale) during early lactation is at severe risk of reproductive failure later in the cycle.
Mid Lactation (100–200 DIM)
By mid-lactation, the cow's feed intake has usually caught up to her energy requirements, bringing her back into a positive energy balance. Milk production begins a slow, steady decline from the peak achieved in early lactation. During this phase, cows should begin to slowly regain the body condition they sacrificed during early lactation. The pressure on the metabolic system begins to ease.
This phase is also the optimal window for getting the cow pregnant again. With the extreme stress of early lactation behind her and her energy balance stabilized, reproductive efficiency naturally improves. High-quality nutrition remains critical to maintain a slow, steady decline in milk rather than a precipitous drop. Maintaining high dry matter intake during mid-lactation is the key to strong persistency. Farmers must continue to feed high-quality rations, but can begin substituting slightly less expensive forage sources as the raw energy demand drops from its peak.
Late Lactation (200–305 DIM)
In late lactation, milk production continues its gradual decline as the pregnancy advances. The cow's energy needs for milk production are significantly lower, but she is now funneling massive amounts of energy and nutrients toward the rapidly growing fetus. Concurrently, she is replenishing her own body fat reserves in final preparation for the next dry period and subsequent lactation.
Farmers must carefully monitor body condition during this phase; over-conditioning cows in late lactation is a recipe for disaster. Fat cows are highly prone to severe metabolic problems—such as ketosis, milk fever, and displaced abomasums—after their next calving. Rations in late lactation are typically adjusted, lowering energy density by increasing fiber content, to prevent cows from becoming overly fat while still supporting fetal growth and maintaining moderate milk output.
The Dry Period (~60 Days)
After approximately 305 days of milking, the cow is "dried off," meaning she is no longer milked. This gives her udder tissue time to involute, rest, and regenerate for the next cycle. The dry period, usually lasting around 60 days, is emphatically not a time of rest for the farmer; it is a critical preparatory phase for the upcoming lactation.
Proper dry cow management, especially during the "transition period" (the final 21 days before calving), is the cornerstone of a successful subsequent lactation. Transition diets are carefully balanced to prepare the rumen papillae for the upcoming onslaught of high-energy lactating rations. Crucially, calcium metabolism is managed through specialized diets (such as negative DCAD rations) to prevent hypocalcemia (milk fever) at calving. A cow that navigates the dry period and transition phase smoothly is virtually guaranteed to have a stronger, more profitable lactation curve.
Get dairy management tips weekly
Join 200+ dairy farmers getting practical KPIs, breeding insights, and profitability tips — no spam, unsubscribe anytime.
3. Peak Milk: The Most Important Day of a Cow's Year
Peak yield is defined as the highest daily milk production a cow achieves during her lactation cycle. As noted, this typically occurs between 40 and 70 DIM. This single metric is heavily scrutinized by dairy managers because it sets the baseline trajectory for the entire year's production. The higher the peak, the higher the entire curve sits on the graph.
There is a well-established and highly reliable "golden rule" in dairy farming regarding peak milk: Every 1 kg of extra milk at peak yield roughly translates to 200–250 extra kg of milk across the full lactation. Because the post-peak decline is mathematically a percentage of the peak value, a higher starting point results in a massive compounding effect over 305 days. If a manager can push a herd's average peak up by just 2 kg per cow, the financial return over the year is immense.
Achieving a high peak requires pristine transition cow management and zero compromises on early lactation nutrition. If a cow suffers from milk fever, metritis, or a retained placenta in the first week after calving, her peak yield will be permanently suppressed. Ensuring excellent dry matter intake immediately post-calving is the single most effective way to drive peak milk upward. Comfort, bunk space, unlimited access to clean water, and stress-free handling all contribute to the cow's ability to maximize her peak yield.
4. Persistency: The Metric That Separates Good Farms from Great Farms
While peak milk sets the absolute ceiling, persistency determines how effectively the cow maintains that production level over time. Persistency is defined as a cow's ability to maintain her milk yield after reaching peak production. A highly persistent cow has a "flatter" lactation curve, whereas a cow with low persistency experiences a rapid, sharp decline, plummeting quickly from her peak.
For standard Holstein cows, a normal monthly decline after peak is generally between 5% and 8% per month. Jersey cows often exhibit slightly less decline, meaning slightly better persistency on a percentage basis. Evaluating your herd's persistency requires tracking this month-over-month drop. Let's examine a typical monthly decline trajectory for a high-performing cow:
| Month Post-Peak | Expected Daily Yield (Assuming 45kg Peak & 7% Monthly Decline) | Curve Shape Indicator |
|---|---|---|
| Month 1 (Peak) | 45.0 kg | Baseline Maximum |
| Month 2 | 41.8 kg | High Persistency Phase |
| Month 3 | 38.9 kg | High Persistency Phase |
| Month 4 | 36.2 kg | Transition to Mid Lactation |
| Month 5 | 33.7 kg | Mid Lactation Maintenance |
| Month 6 | 31.3 kg | Mid Lactation Maintenance |
High persistency is highly desirable because it is strongly associated with better overall cow health, improved fertility, and lower metabolic stress. Cows with flatter curves do not have to endure the extreme metabolic highs and devastating lows of those with sharp peaks and steep drops. The metabolic burden is spread more evenly across the year. Low persistency is often a red flag for underlying issues such as poor forage quality, inadequate protein in the diet, or subclinical disease lingering from early lactation.
Furthermore, modern dairy operations are increasingly exploring extended lactations (milking beyond the traditional 305 days, sometimes up to 400 days or more) for highly persistent cows. By extending the lactation of a persistent cow, the farm reduces the frequency of high-risk transition periods over that cow's lifetime, ultimately improving her longevity and lifetime profitability.
5. Parity Effects: First Lactation vs Mature Cows
A cow's lactation curve is not a static biological absolute; it changes significantly as she ages and matures. Parity—the number of times a cow has calved—has a profound impact on both the absolute peak yield and the fundamental shape of the lactation curve.
First-calf heifers (Parity 1) are a unique demographic within the herd. Because they are still physically growing, they must partition their nutritional intake toward both milk production and continued skeletal and muscular growth. As a result, their peak yield is typically about 25% lower than that of mature cows. However, first-lactation heifers possess incredible biological persistency. Their lactation curves are significantly flatter, with a much slower rate of decline post-peak compared to older cows.
By the time a cow reaches her 3rd to 6th lactation, she typically achieves her lifetime maximum peak yield. She is fully physically mature and can dedicate maximum metabolic resources solely to milk synthesis and maintenance. Below is a detailed breakdown of how parity influences peak yield and curve shape:
| Parity (Lactation Number) | Relative Peak Yield | Curve Shape Characteristics |
|---|---|---|
| Lactation 1 (Heifers) | ~75% of mature peak | Very flat, highly persistent, slow decline |
| Lactation 2 | ~90% of mature peak | Moderate slope, intermediate peak |
| Lactation 3–6 (Mature) | 100% (Maximum genetic potential) | Steeper curve, rapid rise, highest absolute peak |
| Lactation 7+ | Slight decline begins | Varies heavily by overall health and udder structure |
6. How Diseases Destroy the Lactation Curve
The lactation curve is an incredibly sensitive biological indicator. It responds rapidly to the health status of the cow, particularly during the highly vulnerable transition period and early lactation phase. Diseases and metabolic disorders occurring in the first 30 days in milk can severely depress peak yield, permanently altering the trajectory of the entire 305-day cycle and costing the farm thousands of dollars in lost milk.
Mastitis during early lactation is particularly devastating. The infection physically damages the secretory tissue (alveoli) within the udder. Even if the infection is rapidly identified, treated, and completely cleared by the cow's immune system, the lost alveolar cells cannot be fully regenerated during the current lactation cycle. This physical damage severely flattens the curve and permanently suppresses peak milk output for the year.
Ketosis and other metabolic disorders—such as hypocalcemia (milk fever) or a displaced abomasum (DA)—dramatically reduce a cow's feed intake. When a cow goes off feed in early lactation, her negative energy balance deepens to critical, dangerous levels. The body responds to this perceived starvation by rapidly dialing back milk production to survive. A cow that suffers from severe clinical ketosis in the first 30 days in milk may never reach her genetic peak potential. The loss is compounding; a botched transition leading to a DA might cost the farm hundreds of liters of lost production over the year, far outweighing the direct veterinary costs of treating the initial disease.
7. Management Strategies to Improve the Curve
Maximizing the total area under the lactation curve (total milk volume) requires intense, unwavering focus on both environmental management and nutritional precision. Genetics provide the potential, but management realizes it. Here are the leading strategies employed by top-tier dairy managers worldwide:
- Perfecting the Transition Period: The 21 days before and 21 days after calving dictate the success of the entire curve. Providing dedicated, low-stress housing, specialized transition rations (like carefully monitored DCAD diets), and immediate post-calving care prevents the metabolic crashes that permanently ruin peak yield.
- Photoperiod Management: Implementing controlled lighting in the barn is one of the highest ROI investments a farm can make. Specifically, providing 16 hours of bright light (150-200 lux) followed by 8 hours of uninterrupted darkness alters the cow's hormonal profile (specifically melatonin and IGF-1). This simple environmental adjustment is proven to increase milk yield by 5–8% across the herd without negatively impacting feed efficiency.
- Aggressive Bunk Management: During early lactation, feed must be constantly pushed up, fresh, and readily available 24 hours a day. Any restriction in feed access, even for a few hours, deepens the negative energy balance phase. Adequate bunk space (minimum 24-30 inches per cow) is mandatory so subordinate cows are not bullied away from the feed line.
- Heat Stress Mitigation: Cows naturally suppress milk production to reduce metabolic heat when ambient temperatures and humidity rise. Heat stress directly crashes persistency. Industrial fans, automated sprinklers, and adequate shade are not luxuries; they are mandatory infrastructure to maintain a flat curve through the sweltering summer months.
- Consistent Milking Routines: Stress directly inhibits oxytocin release, which prevents complete milk letdown. A calm, consistent, and gentle milking routine ensures the udder is fully emptied, signaling the body to continue synthesizing maximum milk volumes.
8. How to Read & Track Your Herd's Curve
In the modern dairy era, raw data is abundant. Modern herd management software automatically plots the lactation curves of individual cows and the herd as a whole. However, raw data must be mathematically standardized to be truly useful for management decisions. Because cows calve at different ages, in different seasons, and at different parities, the industry relies on a vital metric called 305-day ME (Mature Equivalent).
The 305-day ME mathematically adjusts a cow's actual, real-time milk record to what she would have produced if she were a mature cow calving under standardized conditions. This brilliant statistical tool allows farmers to fairly compare the underlying genetics and performance of a first-lactation heifer against a fourth-lactation veteran, removing the biological bias of age and maturity.
When analyzing your herd's curves on your management dashboard, you must look for anomalies and deviations from expected norms. For example, if your mature cows are peaking at a volume less than 1.3 times the peak of your heifers, it is a massive red flag. It is a strong indicator of transition cow mismanagement, overcrowding, or systemic metabolic disease that is artificially suppressing your adult cow performance.
Tracking the curve is not a monthly chore; it is a daily discipline. By monitoring daily deviations in milk weights, managers can identify sick cows days before clinical symptoms appear, allowing for early intervention that protects both the cow's welfare and her lactation curve.
Maximizing every phase of this curve is the goal of our how to increase milk production guide. For breed-specific curve shapes and peak volumes, see the Holstein and Jersey production guides, and benchmark your herd against global averages.
Frequently Asked Questions
What is the standard length of a dairy cow's lactation curve?
The standard measured length for a dairy cow's lactation is 305 days. However, many modern operations are exploring extended lactations beyond 305 days to reduce transition stress and optimize lifetime yields.
When does a dairy cow reach peak milk yield?
Peak yield typically occurs between 40 to 70 days in milk (DIM), depending on the cow's parity, genetics, and health status.
Why is the early lactation phase associated with negative energy balance?
In early lactation (0-100 DIM), a cow's milk production increases faster than her feed intake capacity, meaning she expends more energy producing milk than she consumes, forcing her to mobilize body fat reserves.
What is lactation persistency?
Persistency refers to a cow's ability to maintain high milk production after reaching her peak yield. A higher persistency means a flatter curve and a slower, more gradual decline in milk volume.
How much extra milk does 1 kg of peak yield translate to over the entire lactation?
As a general rule of thumb, every additional 1 kg of milk produced at peak yield translates to approximately 200 to 250 extra kg of milk across the entire 305-day lactation.
How do diseases affect the lactation curve?
Metabolic disorders like ketosis, or infections like mastitis during early lactation, can severely flatten the curve, reducing peak yield and significantly lowering overall lactation performance.
What is the effect of parity on the lactation curve?
First-calf heifers typically produce about 25% less at peak yield compared to mature cows, but they have higher persistency (a flatter curve). Peak yield usually maximizes during the 3rd to 6th lactation.